Who Left the Labor Force during the Pandemic and Great Recessions?
Recessions are associated with declines in employment as economic activity contracts. But what happens after workers separate from their jobs? Some will remain in the labor force as either employed (meaning they find a new job or return to their previous one) or unemployed (meaning they remain without a job but continue searching). Others will exit the labor force.
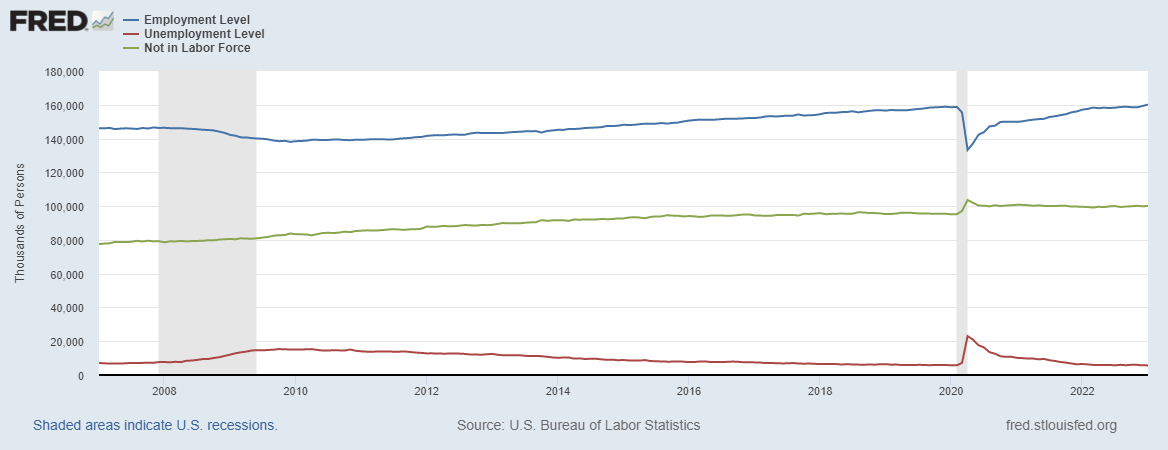
You can see declines in overall U.S. employment during recessions—along with increases in the number of unemployed workers and those out of the labor force—in the following graph. The gray shaded areas represent:
- the Great Recession, which began in December 2007 and ended in June 2009
- the COVID-19 pandemic recession, which began in February 2020 and ended in April 2020

NOTE: The series in this graph are from the Bureau of Labor Statistics and are based on the Current Population Survey.
In a Review article published in January, St. Louis Fed economist Victoria Gregory examined which workers exited the labor force after separating from their jobs around the Great Recession or the pandemic recession. She also looked at their labor force status one year later.
“I find that in both recessions, workers who left the labor force shortly after their job loss (exiters) tended to be more female, less educated, and older. The age distribution was especially skewed older during the pandemic recession,” she wrote.
“Another key difference between the two recessions was the persistence of labor force statuses: In the aftermath of the pandemic, people who left the labor force were more likely to come back than in the Great Recession and vice versa,” she added.
Workers Whose Labor Force Status Was Analyzed
Gregory used data from the Current Population Survey (which is commonly known as the household survey) via Integrated Public Use Microdata Series. Households participating in the CPS are surveyed for four consecutive months, not surveyed for the next eight months, and then surveyed again a final time for the next four months.
For her analysis, Gregory focused on people who were employed the first month they were surveyed and then either unemployed or out of the labor force the second month (meaning they had separated from their jobs). She classified people as follows:
- “exiters” if they were out of the labor force in the fourth month they were surveyed (i.e., neither employed nor unemployed)
- “non-exiters” if they remained in the labor force but were unemployed in that fourth month
- “reemployed” if they were employed in that fourth month
She restricted her sample to those who entered the survey in February or March of 2020 to capture those who separated from their jobs at the start of the pandemic, and between December 2007 and June 2009 to capture those who separated from their jobs during the Great Recession.
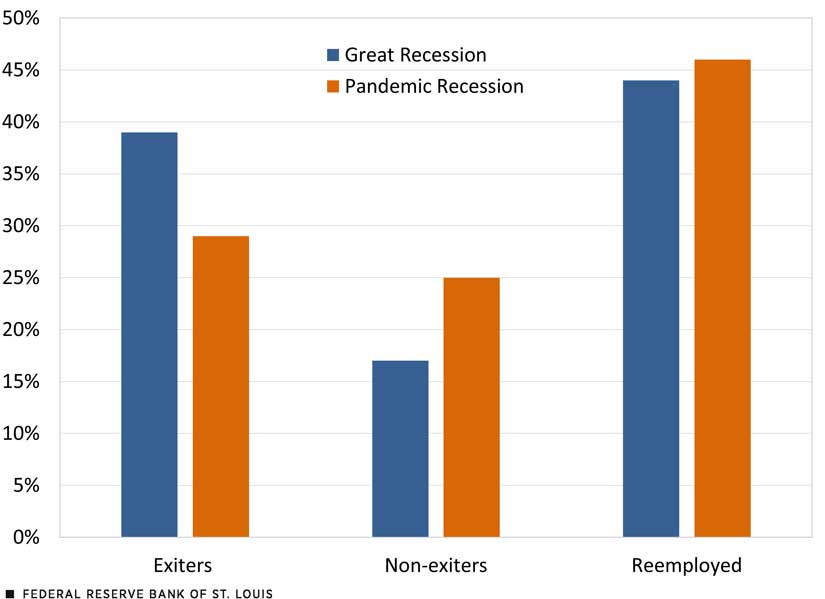
The chart below shows that a higher share of workers who separated from their jobs during the Great Recession were out of the labor force in the fourth month they were surveyed.
Higher Share of Great Recession Job Separators Exited Labor Force

SOURCE: This figure is based on Table 2 in Victoria Gregory’s January 2023 Review article, “Labor Force Exiters around Recessions: Who Are They?”
NOTES: The sample consists of workers who were employed in the first month they were part of the Current Population Survey but were separated from their jobs in the second month. “Exiters” refers to those who were out of the labor force in the fourth month they were surveyed, “non-exiters” refers to those who were unemployed in that month, and “reemployed” refers to those who were employed in that month.
Greater Shares of "Exiters" Were Older or Women
Gregory highlighted some of the features of job separators during the Great Recession and pandemic recession. (For additional characteristics, see Table 3 in her article.)
Gender
Gregory found that women made up a higher share of those who exited the labor force in both recessions (around 60%). Of those who remained in the labor force but were unemployed (the non-exiters), women and men had a fairly even split during the pandemic recession at 52% and 48%, respectively, but men far outnumbered women in this category during the Great Recession: 61% vs. 39%.
Age
Exiters tended to be older in both recessions, especially the pandemic one. Those older than 55 made up 30% of those exiting after Great Recession job separation and 38% of those exiting after pandemic recession job separation. “This tendency may have been more pronounced [in the pandemic recession] than in the Great Recession because of health-related risks or appreciating asset values,” Gregory wrote.
Education Level
As a whole, the exiters group tended to have a slightly higher share of less-educated workers than highly educated ones, Gregory noted. During the pandemic, however, more workers with higher education lost their jobs; therefore, the education composition of the three groups (exiters, non-exiters and reemployed) was more similar. But during the Great Recession, those who were reemployed tended to have higher education than those who were exiters or non-exiters.
Great Recession Labor Force Status Was More Likely to Stick
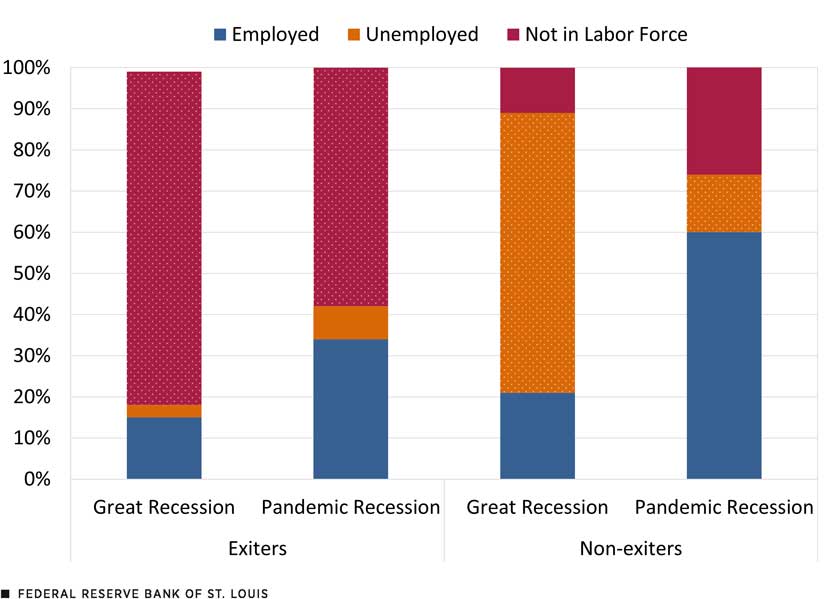
Gregory also analyzed respondents’ labor force status the final month they were surveyed to get a sense of how persistent their status was one year later. For this, she focused on those who had exited the labor force and those who were still in the labor force but unemployed in the fourth month they were surveyed. Gregory's results are shown in the chart below, which is adapted from Table 5 in her article.
Labor Force Status of Exiters and Non-Exiters One Year Later

SOURCE: This figure is based on Table 5 in Victoria Gregory’s January 2023 Review article, “Labor Force Exiters around Recessions: Who Are They?”
NOTES: This sample consists of workers who were employed in the first month they were part of the Current Population Survey, separated from their jobs in the second month, and either out of the labor force in the fourth month they were surveyed (“exiters”) or unemployed in that fourth month (“non-exiters”). The figure shows their labor force status in the final month they were surveyed (about one year after their initial job loss during the Great Recession or pandemic recession). Dotted shading represents the same labor force status one year later. Percentages might not add up to 100% due to rounding.
She found that, one year later:
- 81% of exiters during the Great Recession and 58% of exiters during the pandemic recession were still out of the labor force.
- A higher percentage of exiters during the pandemic recession were employed (34%) than those who exited after Great Recession job separation (15%).
- 68% of the non-exiters in the Great Recession remained unemployed—a much higher share than the 14% of the non-exiters in the pandemic recession.
- Most of the non-exiters in the pandemic recession were employed (60%), versus only 21% of that group during the Great Recession.
- A higher percentage of non-exiters in the pandemic recession (27%) were out of the labor force than around the Great Recession (11%).
“In sum, the takeaway here is that workers who lost their jobs in the Great Recession experienced ‘stickier’ labor force statuses,” Gregory wrote. In other words, they were more likely to have the same status one year later as they did at the end of the initial four months they were surveyed.
Analyses such as those done in Gregory’s Review article and in her October 2021 On the Economy blog post with Joel Steinberg that is focused on labor force exits and COVID-19 are helpful in gaining insights into the labor market recovery from recessions.
This blog explains everyday economics and the Fed, while also spotlighting St. Louis Fed people and programs. Views expressed are not necessarily those of the St. Louis Fed or Federal Reserve System.
Email Us


