


What FRED Can Tell Us about Retirement
More baby boomers are reaching retirement age. On top of that, the COVID-19 pandemic led to a retirement boom, with more Americans retiring than expected based on pre-pandemic trends, which is sometimes called the “Great Retirement.”
Curious about data related to retirement in the U.S. as more and more Americans retire? St. Louis Fed online economic database FRED has more than 2,500 series on the subject. This blog post highlights a few of them—from the aging U.S. population to how much people have saved for retirement.
How Many Americans Are Nearing Retirement Age?
In addition to more Americans retiring than expected, the number who are eligible for retirement benefits like Social Security is increasing. Baby boomers, whose generation was named for the increased birth rate from 1946 to 1964, are 59 to 77 years old in 2023.
Americans born before 1954 are eligible for full Social Security retirement benefits at 66 years old. For those born after 1954, the eligibility age increases by two months for every additional year above 1954, stopping once the eligibility age reaches 67, according to the Social Security Administration.
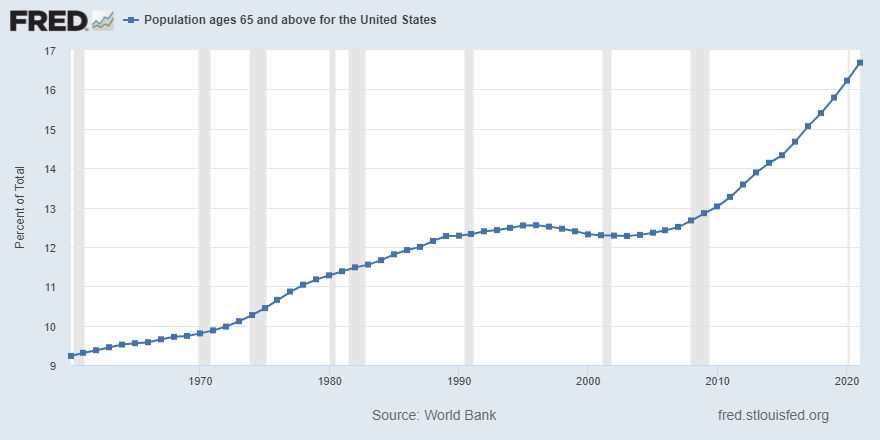
The following FRED graph, using World Bank data, shows 1 in 6 people in the U.S. were 65 years or older in 2021.
How Much Money Are Retired Americans Receiving and Spending?
Instead of getting paid by an employer for work, retirees can receive income from Social Security, pensions, dividends and interest from investments.
We can get a sense for how much, and how much they spend, by looking at data from the Bureau of Labor Statistics’ Consumer Expenditure Surveys.
The FRED graphs below examine “consumer units” or households where the owner or renter—known as “the reference person”—is retired. The first graph shows the average age of the reference person, and the next one shows the average after-tax income and expenditures of the households.

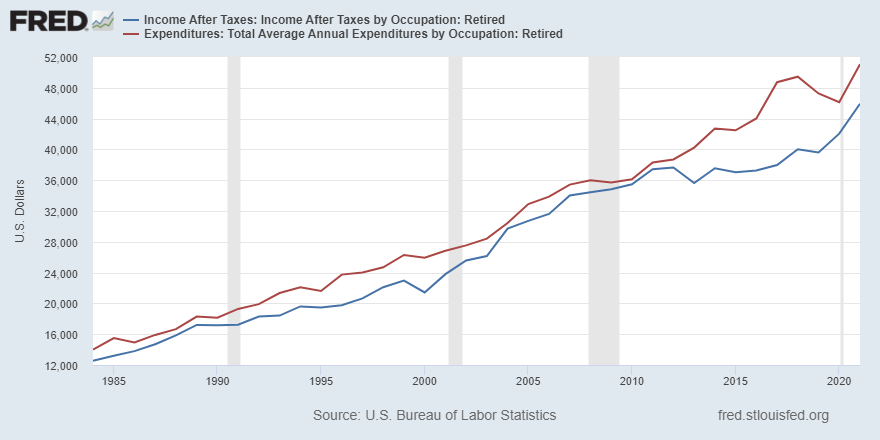
In 2021, the average household in which the reference person was retired spent 111% of its after-tax income, or about $5,100 more than its after-tax income. (Note that these series have not been adjusted for inflation.)
The largest expenses in 2021 for these retiree households were:
- housing, with 37%;
- transportation, with 14%;
- health care, with 14%; and
- food, with 13%.
How Much Money Do Americans Have Saved for Retirement?
One source for aggregate data on retirement savings is the Financial Accounts of the United States from the Federal Reserve Board of Governors.
For example, the FRED graph below shows retirement assets for households and nonprofit organizations, which increased in the fourth quarter of 2022 after declining the previous three quarters. These assets include defined benefit pension funds, defined contribution pension funds, individual retirement accounts (IRAs) and annuities at life insurance companies. (Note that this series has also not been adjusted for inflation.)

FRED Can Tell Us About Retirement and Much More
You can learn more about how to use FRED to find interesting data series on the FRED Help page.
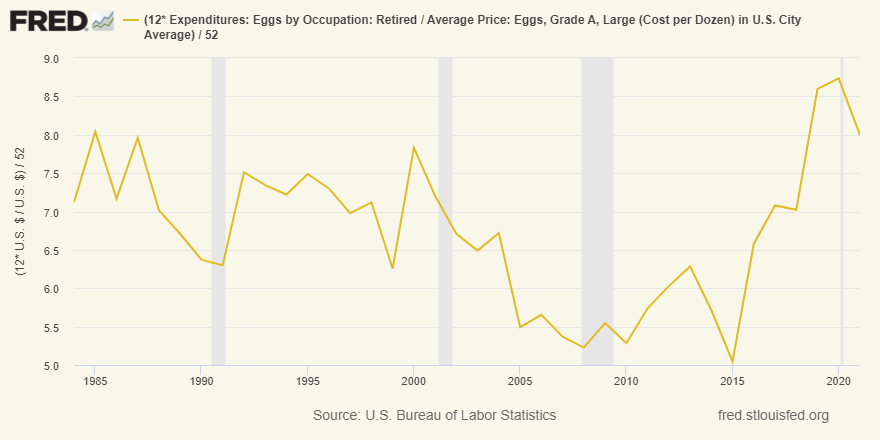
For instance, we can estimate how many eggs retired people in the U.S. eat per week using data from the Consumer Expenditure Surveys and price data. The average retired household bought eight eggs per week in 2021, a three-egg increase from 2015. No yolk, I mean, joke. FRED can help you learn about everything from nest eggs to breakfast eggs.

This blog explains everyday economics and the Fed, while also spotlighting St. Louis Fed people and programs. Views expressed are not necessarily those of the St. Louis Fed or Federal Reserve System.
Email Us