


How the Federal Reserve’s Beige Book Gives Color to Data
When the Fed in 1983 publicly released for the first time a report previously known as the Redbook, the Federal Reserve Board of Governors decided it should go out two weeks before FOMC meetings to detract from the report’s implied importance in policy deliberations.
The Board also changed the cover of the previously internal report to beige to garner less attention, as St. Louis Fed Senior Economist Charles Gascon explained. Almost 40 years later, the reports compiled by the 12 Federal Reserve banks with mostly anecdotal information get plenty of notice when they come out eight times a year.
And what the Beige Book does contrasts with the blandness of its name. The anecdotes in the report “provide color” for the other data and analysis economists consider, said Gascon, who works on the St. Louis Fed’s Beige Book and the Bank’s portion of the national summary.
At a recent St. Louis Fed event, Gascon and Associate Economist Nathan Jefferson gave an inside look at how researchers add that splash of color to economic data by gathering hundreds of pages worth of information and condensing it down to a few pages.
What the Beige Book Is and What It Does
The Beige Book is a summary of the commentary on current economic conditions that each of the 12 Federal Reserve banks collects from members of the public, Gascon said.
Released two weeks before each regularly scheduled Federal Open Market Committee, or FOMC meeting, the Beige Book is intended to show how the economy has evolved since the last report and add anecdotal context to other data and analysis economists use to gauge how the economy is doing.
The qualitative nature of the publication also helps to “identify emerging trends in the economy that may not be readily apparent in the available economic data,” according to a “Frequently Asked Questions” page on the Federal Reserve Board’s website.
Gascon outlined a few things the information in the Beige Book is not:
- It’s not characterizing the views of Fed officials or staff.
- While there may be some benchmark data, it’s not derived from formal statistics like GDP or the consumer price index.
- It’s not supposed to stand alone.
Other Fed reports and resources are better suited for looking at structural topics like inequality or community health and how they are affecting the economy, Gascon said. (The FAQ has links to some of those resources.)
The Beige Book is primarily a report about changes in economic conditions over short horizons and not about long-term structural differences in the economy, although different groups may share very different experiences, he said.
“It’s meant to be used in conjunction with all the other data and theories and models that we have available,” Gascon said. “They’re anecdotes, they’re little pieces of information, they provide color to the data, but they’re not meant to replace the data and the analysis that we already have.”
What Are the St. Louis Fed’s Sources of Information?
Researchers for the Beige Book contact people in a variety of industries, gathering information through St. Louis Fed boards of directors, advisory groups, surveys, phone calls and emails, as Jefferson highlighted. They also use data from industry and government sources. Respondents’ names and organizations are not disclosed publicly.
Beige Book Information Comes from Several Sources
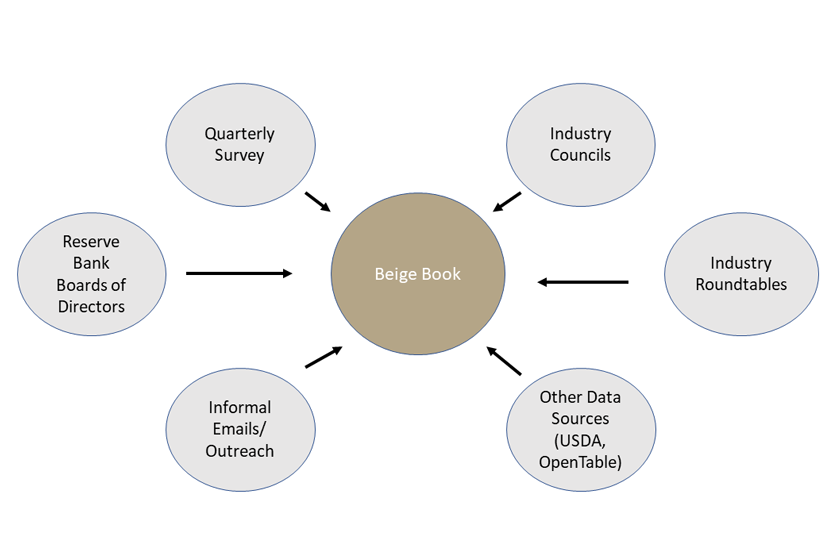
SOURCE: "Beige Book," a May 2022 presentation by Charles Gascon and Nathan Jefferson.
NOTE: Information for the St. Louis Fed Beige Book is gathered through industry councils and roundtables, quarterly surveys, St. Louis Fed boards of directors, informal outreach, and industry and government data sources.
Enlarge image
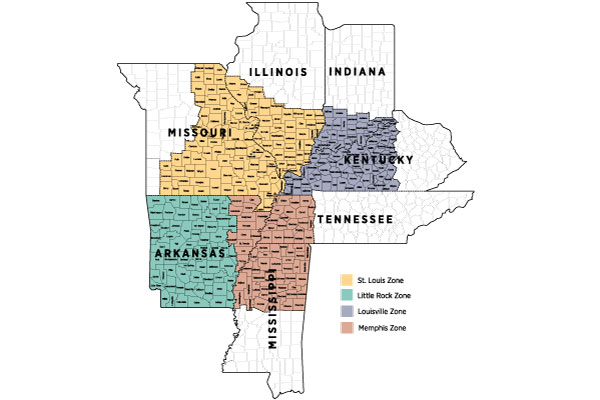
The Eighth Federal Reserve District has four zones with headquarters in St. Louis and branch headquarters in Little Rock, Ark.; Louisville, Ky.; and Memphis, Tenn.
Quarterly surveys
The St. Louis Fed’s Beige Book team sends out an email survey to several hundred contacts at a variety of businesses and nonprofits across the Eighth District, which is the St. Louis Fed’s District, Jefferson said. (The Eighth District includes the entire state of Arkansas as well as parts of Illinois, Indiana, Kentucky, Mississippi, Missouri and Tennessee.) The goal is to match the industry mix of the District.
The surveys ask what the contacts are seeing in their industries and economies, with questions about the outlook and sales over the previous quarter always appearing, Jefferson said. But the researchers also can address topics they’d like more information on, or that’s particularly relevant at the time, he said.
For example, a recent inflation-related question asked whether respondents felt their businesses could raise prices over the next three to six months, he said.
The mix of businesses and nonprofits that respond changes. For instance, retailers are more difficult to contact in the fourth quarter, and responses from contacts in tourism and travel decline in the summer—their busy seasons.
“More conversational” sources
The quarterly surveys help provide information for half of the eight Beige Books issued each year. Researchers also draw from a range of other sources, Jefferson said. Advisory groups are one source that is “more conversational,” he said.
In a 2019 “Voices of the Fed” video, Dr. Diana Han said she thought the most important responsibility a St. Louis Fed industry council member has is to “share with the Federal Reserve what we see, hear and feel on the front lines in our districts.”
Han, vice president of global health for Unilever, is a member of the St. Louis Fed’s health care industry council, one of four such St. Louis Fed councils representing industries critical to the Eighth District, which also include agriculture, real estate and transportation. In addition, researchers get information from other advisory groups, such as representatives of other industries invited to participate in roundtables held four times a year, Jefferson said. The boards of directors for the St. Louis Fed also serve as a source of anecdotal information. (Branch headquarters are in Little Rock, Ark.; Louisville, Ky.; and Memphis, Tenn.)
Sometimes an observation that comes from an advisory group will be incorporated into a survey question. Information may not immediately be included in a Beige Book, but if it keeps coming up and is mentioned by other sources, “then it might turn into something that becomes a more central part of the Beige Book,” Jefferson said. Informal phone calls also are a way to get information, sometimes more quickly, he said.
“We want the kind of anecdotal information that can help us build links, that can help broaden our knowledge, that can help give us industry-specific information that we might not be able to get from the big data releases,” he said.
Government and private data sources
Data from government sources like the U.S. Department of Agriculture and industry-specific private sources also are reviewed for Beige Book reports, Jefferson said. Statistics from OpenTable, for example, were helpful in getting a sense for the extent of reopening following COVID-19 pandemic shutdowns.
An OpenTable Chart Shows 2020 Trend for Restaurant Traffic
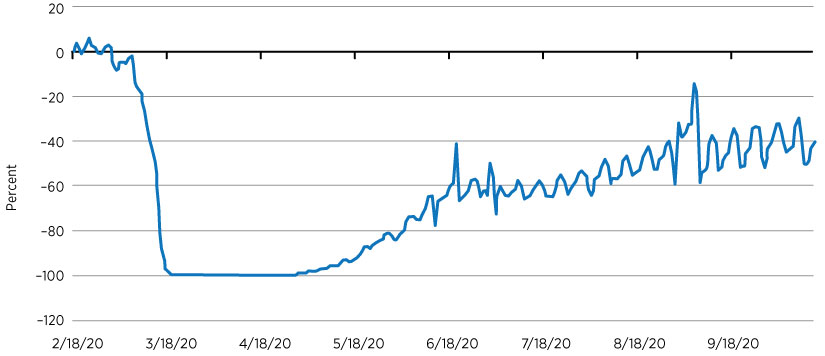
SOURCES: OpenTable data and presentation by Charles Gascon and Nathan Jefferson.
NOTES: Data compiled Oct. 16, 2020, represents year-over-year change in seated diners at a sample of all restaurants on the OpenTable network across all channels: online and phone reservations and walk-ins.
The usefulness of and sources for data can change, Gascon said. For instance, OpenTable information was of particular interest because of pandemic shutdowns and reopening, but relationship shifts can lead to changes as well, such as if a contact at one organization moves to another one.
“There is very much an art to this process,” Gascon said. “Which is why, like I said, it doesn’t replace the formal statistics for exactly that reason.”
How Long the Beige Book Reports Are
Researchers end up with hundreds of pages of information, Jefferson said. They must condense that to two summary pages, which are used for the national and regional Reserve bank reports. The St. Louis Fed report also includes an appendix on the economic conditions and outlooks for each of the District’s four zones and a summary of survey results when available. (See the map above.)
For each Beige Book, a different Reserve bank will write up the overall national summary, Jefferson said. The summary includes paragraphs for overall economic activity, labor markets and prices, as well as a paragraph covering the highlights for each Federal Reserve district. That national summary is usually what gets the most media attention, he said.
“It’s about finding the things that are important and really condensing it down to the essentials,” Jefferson said, “so that the national summary, and whoever’s reading the national summary, has a sense of what’s really important, and what’s really changed, since the previous Beige Book.”

This blog explains everyday economics and the Fed, while also spotlighting St. Louis Fed people and programs. Views expressed are not necessarily those of the St. Louis Fed or Federal Reserve System.
Email Us