


How U.S. Home Life Has Changed between Generations
How have family structure, leisure time amounts, and the household division of labor changed over time and across generations in the U.S.? Among other trends, millennials have lower marriage rates and more leisure time than previous generations.
Those are two of the findings in “Work, Leisure, and Family: From the Silent Generation to Millennials.” The article, published in the fourth quarter 2021 issue of the St. Louis Fed publication Review, focuses on changes between generations, from people born in the 1940s to millennials.
The authors are George-Levi Gayle, who is a research fellow at the St. Louis Fed and a professor of economics at Washington University in St. Louis, and Mariana Odio-Zuniga and Prasanthi Ramakrishnan, who are both Ph.D. candidates in the university’s Department of Economics.
This blog post highlights changes in some home life trends: housework hours, leisure, marriage, divorce and having children.
Why is it important to study these types of trends? The authors wrote that changes in family, fertility and labor market behavior over the past half-century “have consequences for labor market productivity and the viability of Social Security and other programs.”
Housework Hours Decline for Women, Increase for Men over Time
Gayle, Odio-Zuniga and Ramakrishnan found that overall hours spent on housework have declined over time.
They noted that men have seen a significant decline in the number of hours worked in the labor market—that is, in paid jobs—and an increase in hours devoted to housework, with millennial men spending more hours on housework than men of earlier generations.
“The opposite is true for women: Their reduction in hours devoted to housework over generations has been more than offset by the increase in hours devoted to market work,” they wrote. They added that the overall decline in the number of housework hours suggests that the decline for women has not been offset by the increase for men.
In addition, the authors pointed out that married women have seen a drastic decline in housework hours—from 1,641 hours in 1968 to 709 hours in 2015.
Overall Hours Spent on Housework Have Declined
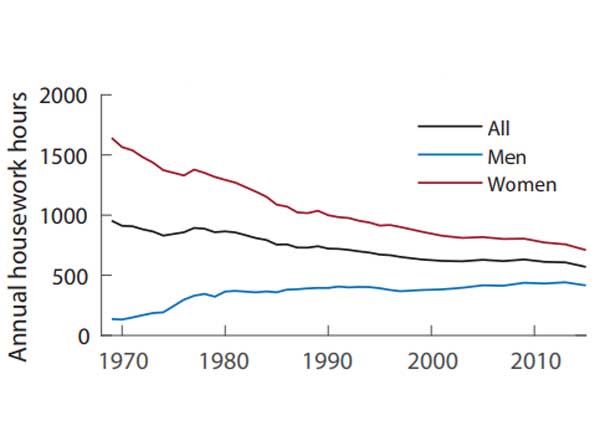
SOURCES: Panel from Figure 5 in “Work, Leisure, and Family: From the Silent Generation to Millennials (PDF),” by George-Levi Gayle, Mariana Odio-Zuniga and Prasanthi Ramakrishnan in the fourth quarter 2021 issue of St. Louis Fed Review, with data from the PSID and the authors’ calculations.
NOTES: The chart data are for the head of household and spouse and include only those ages 18 to 65. Annual housework hours are calculated by taking the weekly housework hours and multiplying by 52.
Millennials Have More Leisure Hours
In studying trends in hours dedicated to leisure, the authors used a measure that subtracts annual hours of market work and of housework from the total number of hours, assuming eight hours per day for sleep and personal care.
While people ages 25-54 have the fewest hours of leisure, the time they can use for leisure has increased from 1968 to 2015, the authors found.
Women’s leisure hours have increased over generations but there is no clear pattern for men, the article said. “However, for both men and women, Millennials enjoy a higher level of leisure than previous generations,” the authors wrote.
The authors also noted that the increase in the number of leisure hours for women over generations is largely due to the increase among married women.
Leisure Time Increased for 25- to 54-year-olds
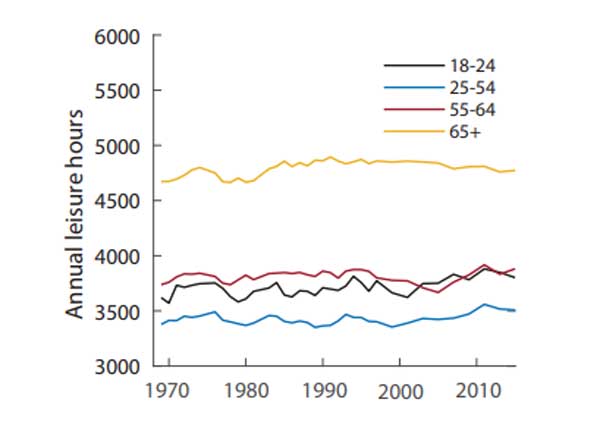
SOURCES: Panel from Figure 7 in “Work, Leisure, and Family: From the Silent Generation to Millennials,” with data from the PSID and the authors’ calculations.
NOTES: The chart data are for the head of household and spouse and include only those ages 18 to 65. Leisure is calculated as the difference of the sum of annual work and housework hours from total hours.
Marriage Rates Decline across Generations
Gayle, Odio-Zuniga and Ramakrishnan found a sharp decline in marriage rates over generations. They pointed out that millennials have the lowest rates compared with other generations at similar ages.
They also found differences by education. “Lower-educated individuals have retreated from marriage, and this finding is the most pronounced among Millennials,” they wrote. “However, while Millennial college graduates are delaying marriage significantly, they do catch up with previous generations by ages 30 to 33.”
While marriage rates are lower for the younger generations, cohabitation rates are up. The authors noted that rates of cohabitation, or living together outside marriage, are much higher early on in life for Generation X and millennials, but “the rates drop off significantly after that, indicating cohabitation itself is transitory.”
More Gen X and Millennials Have Cohabitated in Their 20s
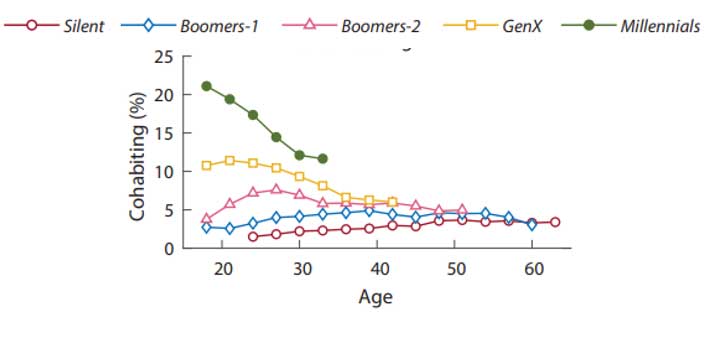
SOURCES: Panel from Figure 10 in “Work, Leisure, and Family: From the Silent Generation to Millennials,” with data from the PSID and the authors’ calculations.
NOTES: The chart data are for the head of household and spouse and include only those ages 18 to 65 and are plotted for three age-group intervals for smoothing of the trend. For example, age 18 refers to the 18-20 age group.
Divorce Rates Rise over Generations
For the divorce rate in their analysis, Gayle, Odio-Zuniga and Ramakrishnan used the percentage of people ages 18 to 65 who were legally married in the previous period but not the current one.
They noted that the overall divorce rate declined after 2000, a trend affected by the declining marriage rate. They also noted that college graduates have the lowest divorce rates of the three education groups they examined (high school graduates, those with some college, and college graduates).
The authors also analyzed the probability of divorce based on the number of years of marriage and found differences across generations. For instance, the probability of divorce remained fairly stable over the marriage tenure for the silent generation. But that wasn’t the case for other generations.
“The subsequent generations present rising divorce rates and more pronounced duration dependence; that is, as the length of the marriage increases, the likelihood of divorce decreases, with Millennials having the highest probability of divorce after five years of marriage,” the authors wrote.
The Number of Children per Woman Has Declined over Time
We’ve seen that marriage and divorce rates have changed over time. What about fertility trends over time and across generations?
To answer this question, one measure Gayle, Odio-Zuniga and Ramakrishnan looked at is completed fertility—or the average number of children born per woman in the U.S. who has reached the end of her childbearing years—for women ages 45-50. “On average, in 1968, women had 3.04 children and by 2015 that number had decreased to 2.01,” they wrote.
The authors also looked at how old men and women were when they had their first child, restricting this analysis to people ages 35-40. They found that the parents’ age at the first birth increased from 1968 until the late 2000s; it then began to decline in 2011 for men and in 2013 for women.
Trends in Number of Children and Parents’ Age at First Birth
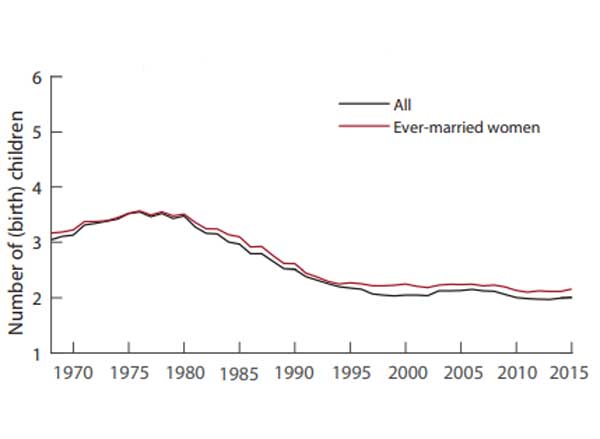
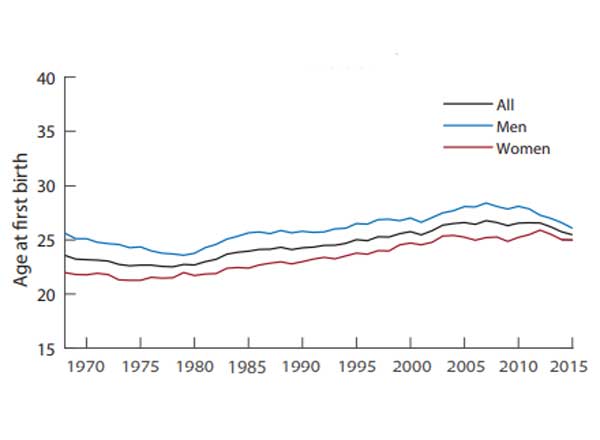
SOURCES: Select panels from Figure 8 in “Work, Leisure, and Family: From the Silent Generation to Millennials,” with data from the PSID and the authors’ calculations.
NOTE: The sample is restricted to women ages 45-50 in the first panel and to people ages 35-40 in the second panel.
The fertility changes offer one example of the consequences of socioeconomic changes for programs like Social Security in countries like the U.S., the article said—without enough children born to maintain population numbers, it’s harder to support the “pay-as-you-go” program.
“Over the past half-century,” the authors wrote, “some of the most striking socioeconomic changes in developed countries have been the radical changes in the family structure, fertility behavior, and the division of labor within the household.”
This blog explains everyday economics and the Fed, while also spotlighting St. Louis Fed people and programs. Views expressed are not necessarily those of the St. Louis Fed or Federal Reserve System.
Email Us