What Do Bond Yields Signal about the Economy?
The topic of bond yields has been frequently discussed since the Federal Open Market Committee in late 2021 and early 2022 began indicating that it would soon start making monetary policy moves that could affect bond yields. The FOMC raised the target for the fed funds rate in March and said further increases were likely to be appropriate.
But what exactly do people mean when they talk about bond yields? A bond yield is a numerical representation of a bond’s returns to a bond purchaser. A “yield curve” is used to get a sense of investors’ risk assessment. Why are the yields an important indicator for investors?
Understanding Bond Yields
First, let’s look at bonds. A bond is an instrument that pays one or more fixed payments at specified times. Selling a bond is a way by which the seller borrows from the buyer—or the buyer lends to the seller.
For that reason, it is important for the investors to consider the amount of compensation they will get in return. Looking at a bond’s yield is one way to do so.
There are multiple definitions and ways to calculate the bond yield, including current yield and yield to maturity.
Current Yield
Current yield is the expected annual return of a bond based on annual interest payment and the bond’s current price. Current yield differs from another type of yield, “coupon” yield, as the former takes into account the current market value of the bond while the latter considers the original face value.
This distinction is important because the market price of a bond can differ from its par or face value.Note that a bond does not have to be issued at its par value. To calculate current yield:
Current Yield = Annual Interest Payment / Current Market Value
We can see that current yield fluctuates depending on the market price of the bond. If the bond’s face value is $100 and pays an annual coupon payment of $4, then the coupon yield will be (4/100) or 4%. But if an investor buys the bond at a premium, purchasing it at the current market price of $105, the current yield will be (4/105), or around 3.8%, which is slightly lower than the coupon yield.
Bond prices and yields are inversely related: the higher the price, the lower the yield and vice versa, including for U.S. Treasuries, government debt issued by the U.S. Department of the Treasury.
Yield to Maturity
A bond’s yield to maturity (YTM) is the annualized interest rate that discounts the bond’s coupon and face value payoffs to the market price. That is, it is the interest rate that the bond holder receives on the bond. This calculation, which assumes that the payments are made to the investor in a timely manner, gives a fuller picture of a bond’s yield. An approximation of YTM can be obtained using a formula such as the following:More information can be found in a 1986 Interfaces article, “A Note on Yield-to-Maturity Approximations.”
- Start with (Face Value – Market Value) / Years to Maturity.
- Add the result of No. 1 to Annual Interest Payment.
- Divide the result of No. 2 by the result of: (Face Value + Market Value) / 2.
Treasury Yields Are an Indicator of Investor Confidence
Now that we know what bond yields are, we can start examining why they are an important indicator of the economic outlook to investors, even those who do not invest in bonds themselves.
Investors commonly consider Treasury yields. Since Treasuries are backed by the U.S. government, they are viewed as one of the safest investments and are used as a baseline for many calculations.
Economist Chris Neely, a vice president in the St. Louis Fed’s Research Division, says two things happen during “boom” times:
- Investors require less incentive (extra expected return) to hold risky assets, so the spread between the yields of risky bonds and Treasuries declines.
- Yields on riskless bonds tend to rise as borrowing demand for investment and consumption increases.
Conversely, when investors’ confidence level is low, the demand for Treasuries will increase, hiking up Treasuries’ prices and lowering their yields. Because of this, declining Treasury yields are often viewed as indicating a potential economic slowdown.
The graph above shows the daily market yield on the U.S. 10-Year Treasury. We can see the yield dropped significantly during the COVID-19-induced recession when investor confidence was low.
The Treasury Yield Curve Sends an Economic Signal
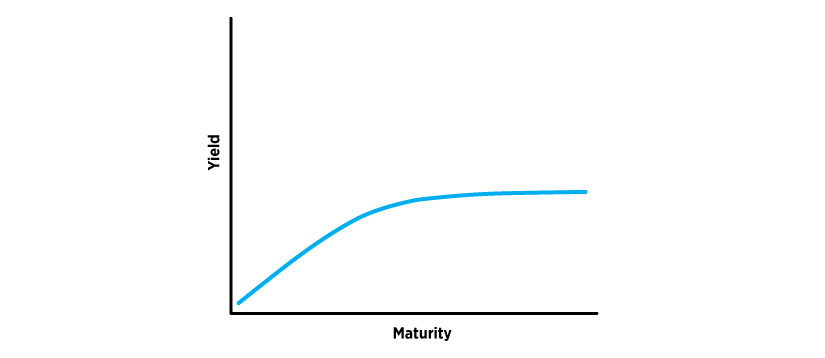
Treasuries with different maturities offer varying yields. A yield curve illustrates yields on debt of similar risk (e.g., Treasuries) across a range of maturities. In the U.S., one of the most common yield curves is the one drawn for Treasury securities.
A Common Yield Curve Shows Yields Rising with Maturity

The figure above shows yield increasing with maturity, which is the most common shape of a yield curve.
Shorter-term rates tend to move with the Fed’s policy rate, or federal funds rate. Investors who tie up their money for longer periods tend to expect a higher payoff as they fear large capital losses on long-term debt, so bonds with longer maturity often have higher yields.
However, when investors lose confidence in the economy, it is not uncommon for the yield curve to invert. An inverted yield curve, where short-term yields exceed long-term yields, potentially happens when long-term investors expect short-term interest rates to decline in the future, so they try to lock in the current yields.
Notes
- Note that a bond does not have to be issued at its par value.
- More information can be found in a 1986 Interfaces article, “A Note on Yield-to-Maturity Approximations.”
This blog explains everyday economics and the Fed, while also spotlighting St. Louis Fed people and programs. Views expressed are not necessarily those of the St. Louis Fed or Federal Reserve System.
Email Us


