How Much Did Something Cost the Year You Were Born?
This post, originally published June 19, 2019, has been updated with more recent information.
We’ve all heard our parents talk about “the good old days.” Whether cheaper gas, simpler technology or nostalgia for their youth makes other generations reminisce about the past, data can lend credence to their claims. Was gas really that much cheaper when you were a kid? How much did coffee cost? What was U.S. GDP the year you were born? Find out with online database FRED.
Created in the early 1990s, FRED has gone from a dial-in bulletin board to a powerful digital tool that houses hundreds of thousands of series. Data range from employment and literacy rates, to the global prices of shrimp and sunflower oil, all the way to county-level commute times.
Who’s it for? FRED is used by everyone from consumers like you to professional economists for research, data presentation and even just for fun!
Say you or your friend has a milestone birthday around the corner. Here’s how to find out …
Born this month in 2004, 20 years old
Gas cost around $1.78 a gallon.
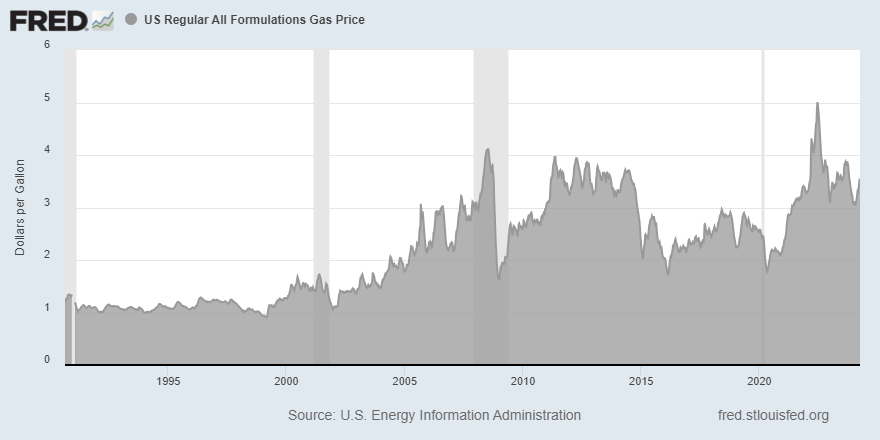
If you search for “gas price per gallon” on FRED, one of the first data series you’ll see is called US Regular All Formulations Gas Price. The graph below displays the weekly average price of all grades of gasoline since 1990 (not seasonally adjusted). Roll over to see individual values, which are found by taking the average of gas prices at about 900 self-service gas stations around the country, tax included.

This series runs from1990 to the present. The gray bars indicate recessions.
For example, you can see that when the series started, the average price of gas was $1.19 a gallon. It rose all the way to $5.01 in the summer of 2022, and it was sitting around $3.52 at the beginning of April 2024.
Born this month in 1994, 30 years old
A pound of coffee cost 91 cents (wholesale).
Simply search “coffee” from the FRED homepage to be greeted with a wide array of data series about our favorite drink.
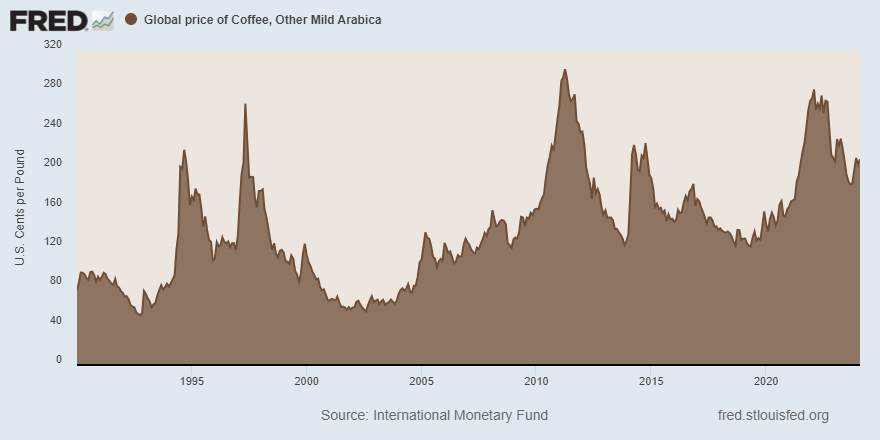
The Consumer Price Index for All Urban Consumers: Coffee series can give you information about how inflation has impacted the price of coffee since 1967. But if you’re looking for more concrete prices, take a look at Global Price of Coffee, Other Mild Arabica, which goes back to 1990.
According to the International Coffee Organization, arabica beans were expected to account for about 60% of global coffee production in the 2023-24 “coffee year,” with the more caffeinated robusta beans making up the other 40%.

This series runs from 1990 to the present.
Remember that this is the global commodity price, so the amounts you see will be significantly lower than what you’d observe on a grocery store shelf.
Born this month in 1984, 40 years old
GDP was about $8.17 trillion (in chained 2017 dollars).
What was the dollar value of all goods and services produced in the U.S. the year you were born? Find out with one of FRED’s most popular series: gross domestic product (GDP).
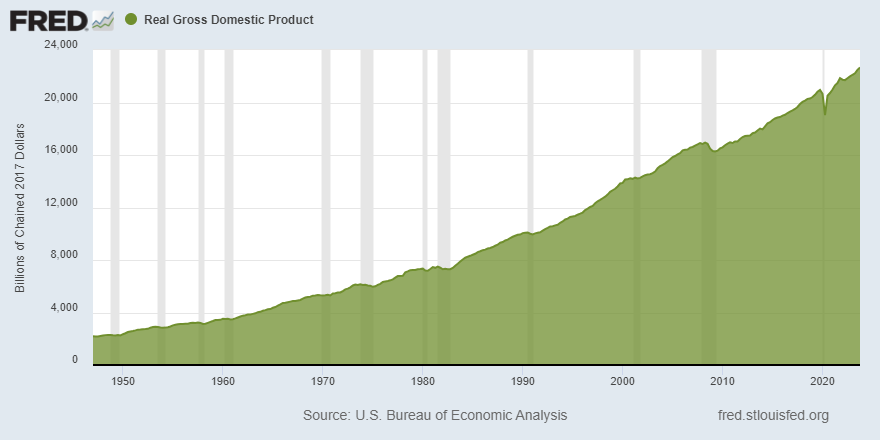
You can select real GDP, which is adjusted for inflation so that all values are reported in the dollars of a base year, or nominal GDP, which reports values in the dollars of the year the data were produced. Real data are easier to conceptualize and compare, so we’ll use real GDP. It is shown in chained 2017 dollars.

This series runs from 1947 to the present. The gray bars indicated recessions.
This is a seasonally adjusted value, meaning that economists have performed statistical calculations on the data to get rid of seasonal fluctuations that may impact the data, such as weather, school schedules and holidays.
Born this month in 1934, 90 years old
More than 13 million gallons of ice cream were produced.
The series Ice Cream Production for United States spans the era from 1918 to 1940, so you’ll probably have better luck finding a grandparent’s or great-grandparent’s birthday.
Likewise, you can line up the data with historical events. The month that the stock market crashed ahead of the Great Depression, October 1929, 15.82 million gallons of ice cream were produced in the U.S. When “The Wizard of Oz” was released in August 1939, Americans produced more than 36.68 million gallons.

This series runs from 1918 to 1940.
Additional Resources
With over 800,000 data series to explore, FRED is a treasure trove of information. Here are just a few to check out:
Want to learn how to get the most out of the database? Check out FRED tutorials.
Heather Hennerich contributed updates to this blog post.
This blog explains everyday economics and the Fed, while also spotlighting St. Louis Fed people and programs. Views expressed are not necessarily those of the St. Louis Fed or Federal Reserve System.
Email Us


