


What Have We Learned from the U.S. Tariff Increases of 2018-19?
In the summer of 2018, the normal pace of global trade encountered an important disruption: The United States increased tariffs to a wide set of imported goods from China, which included such diverse products as electronics, furniture, manufacturing equipment and aerospace components. In this way, the imposed tariffs impacted final consumption goods, intermediate inputs and capital goods used by U.S. households and firms.
All told, these measures affected approximately $376 billion of Chinese exports to the U.S., or around 50% of all the country’s imports from China. The scale becomes even more remarkable when one considers that prior to this campaign, most of these goods faced tariffs of just 3% to 4% and that China was the largest trading partner of the U.S. in terms of imports.
The Impact of Tariffs on Imports
The first figure shows the evolution of effective tariffs on imported goods from China. We define effective tariffs as the value of import duties collected for a set of goods over the dutiable value of the goods. In this way, effective tariffs do not align perfectly to statutory tariffs, as a small number of the goods may enter tariff-free, or some exemptions are created for specific varieties. Nevertheless, our measure of effective tariffs is very close to the statutory tariffs.
Tariffs were implemented in stages and affected different sets of goods. In early July 2018, the first set of goods, labeled List 1, was affected by a statutory tariff increase of 25%, which was added on top of any tariffs previously imposed on those products. In late August 2018, a second list of goods, labeled List 2, was affected by a similar tariff increase, and in late September 2018, a wide range of goods, those in List 3, was affected by an initial tariff increase of 10%, which was hiked to 25% in mid-May 2019.
Effective U.S. Tariff Rate on Imported Goods from China
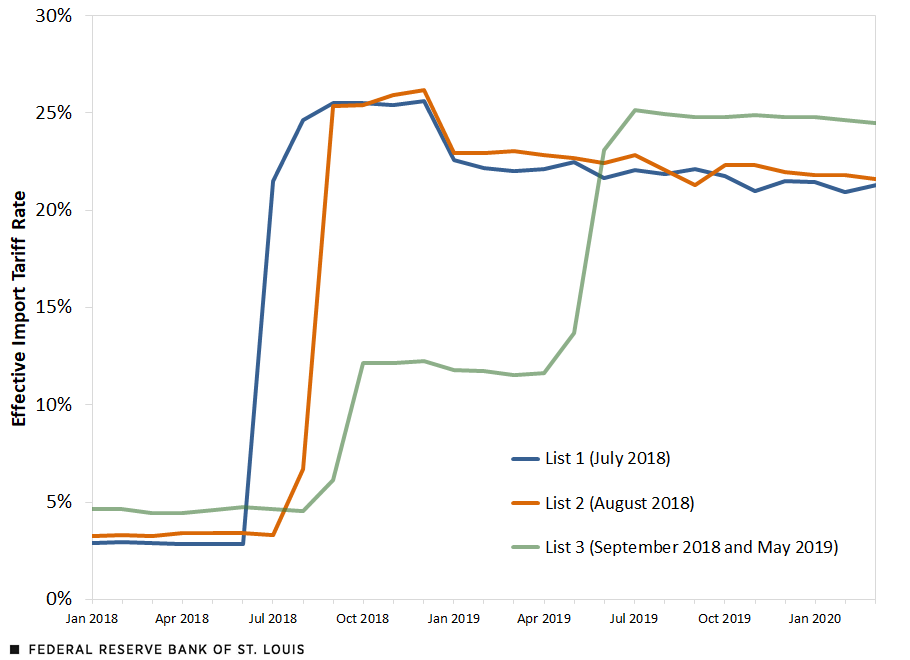
SOURCES: U.S. Census Bureau and authors’ calculations.
NOTE: Effective tariffs are constructed as import duties collected for the affected goods over their dutiable value.
Recent economic literature has found that the prices paid by importers increased one-to-one with the tariff increases, which means that the effective cost to a U.S. importer increased for these goods.For example, see Alberto Cavallo, Gita Gopinath, Brent Neiman and Jenny Tang’s 2021 article, “Tariff Pass-Through at the Border and at the Store: Evidence from U.S. Trade Policy,” in American Economic Review: Insights; Pablo D. Fajgelbaum, Pinelopi K. Goldberg, Patrick J. Kennedy and Amit K. Khandelwal’s 2020 article, “The Return to Protectionism,” in The Quarterly Journal of Economics; and Mary Amiti, Stephen J. Redding and David E. Weinstein’s 2019 article, “The Impact of the 2018 Tariffs on Prices and Welfare,” in Journal of Economic Perspectives. The second figure shows the dramatic and swift effects of tariffs on purchases of the type of goods subject to these higher duties. Chinese imports of these goods declined by roughly 40% from early 2018 to late 2019, a stunning reversal for a trading relationship that had grown almost without interruption for decades.
Nature abhors a vacuum, and so does commerce. As Chinese imports receded, other trading partners filled the void. Imports from Mexico and the European Union of these goods increased gradually relative to the levels of early 2018.
Evolution of Selected U.S. Imports by Largest Trading Partners
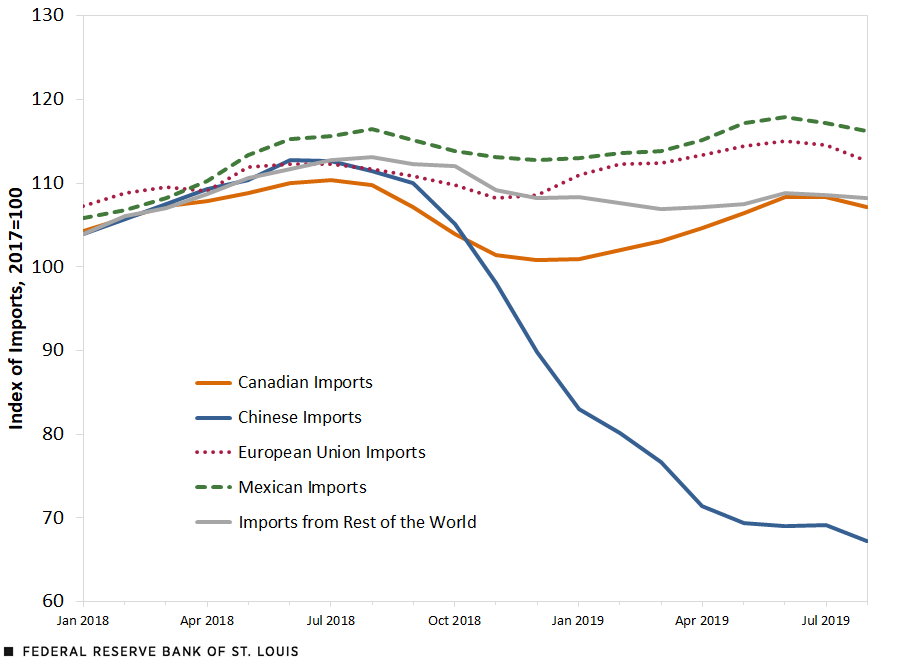
SOURCES: U.S. Census Bureau and authors’ calculations.
NOTE: Imports of the type of goods subject to higher U.S. tariffs. The level is indexed to the average dollar value in 2017, by trading partner, and smoothed using a six-month centered moving average.
How Did Tariffs Affect Prices?
An important question, which is very difficult to answer, is whether tariffs affect prices. As we noted earlier, a few important academic works find evidence that much of the increase in tariffs was passed through almost completely to the price paid by importers and, to a lesser extent, to the price paid by consumers. As only a fraction of imported goods were subject to the tariffs and only a small share of expenditures is spent on imported goods, the effects on overall prices may be small, even with a substantial tariff increase.
Despite these caveats, the following figure shows the evolution of price indexes for several categories of goods in personal consumption expenditures (PCE) from 2016 to 2020, with 2017 as the base year. The figure shows the evolution of prices of all goods except for food and energy, and the price index for some selected groups of goods for which Chinese imports of the tariffed goods are large.PCE price indexes do not discriminate between imported or domestic prices. In this way, the evolution of the different categories shown in the figure is only suggestive of some effects of tariffs on prices. By looking at categories with a high import content of Chinese goods affected by the tariffs, however, the hope is to uncover, informally, these effects. Note that we exclude the price of services in the analysis.
Evolution of Prices of Selected Categories of Goods in Personal Consumption Expenditures
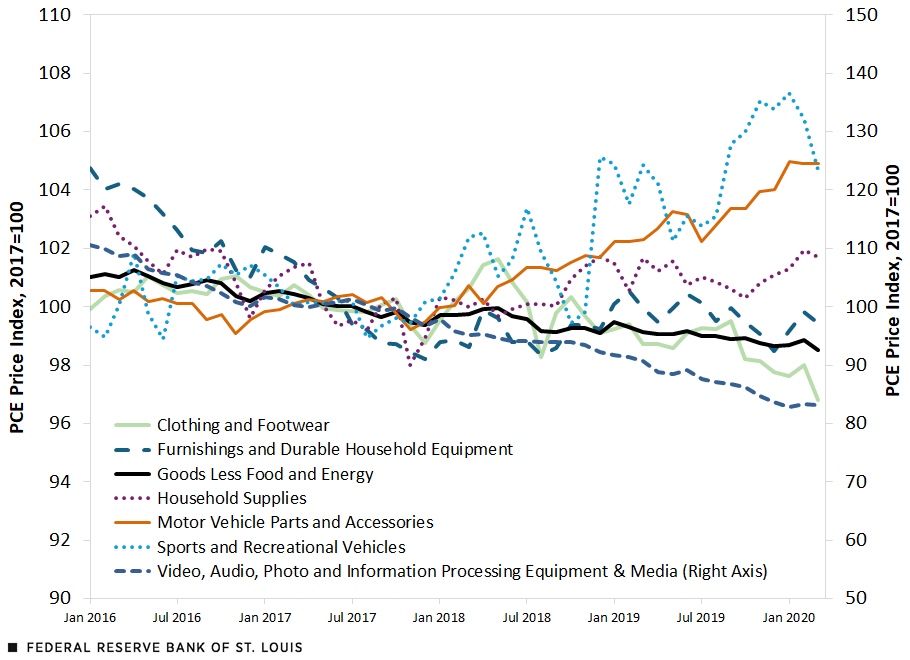
SOURCES: Bureau of Economic Analysis and authors’ calculations.
NOTES: The price indexes are seasonally adjusted. The category “video, audio, photo and information processing equipment & media” is measured on the right-hand axis; all other categories are measured on the left-hand axis. We use two axes to better show the evolution of prices of series that would otherwise be compressed.
For most of the shown categories, the behavior of prices before early 2018 was not too different from the behavior of prices for the category of all goods less food and energy. If anything, for most of these categories, prices were falling at a faster rate than the prices for all goods except for food and energy.
However, from mid-2018 to early 2020, the evolution of prices was somewhat different. While the prices for all goods except for food and energy continued to fall at a mild pace, the prices of the groups shown generally started to increase. The notable exception was the category of “video, audio, photo and information processing equipment & media,” which includes items like televisions, computers and cameras; this category continued its downward trajectory, and it did not appear to be affected by the increase in tariffs to imports of Chinese goods.
On the other hand, sports and recreational vehicles (which include motorcycles, bicycles and recreational boats), motor vehicle parts and accessories, household supplies (which include household cleaning supplies and sewing items) and furnishings and durable household equipment (which include furniture, clocks, carpets and major household appliances) saw an increase in prices. For these sets of goods, prices increased since early 2018, and in some cases, the accumulated price increase was close to 6% by early 2020.We stop our analysis in early 2020, leaving out the pandemic.
In this way, the 2018-19 tariff increases on Chinese imports affected trade patterns, as imports from China declined by approximately 40% while imports from other trading partners like Mexico and the European Union increased. While the overall effect on consumer prices was likely small, partly because of the small share of consumption affected by the higher tariffs, several consumer goods categories showed a different evolution of prices post-2018, suggesting some price pressure from changes in trade policy.
Notes
- For example, see Alberto Cavallo, Gita Gopinath, Brent Neiman and Jenny Tang’s 2021 article, “Tariff Pass-Through at the Border and at the Store: Evidence from U.S. Trade Policy,” in American Economic Review: Insights; Pablo D. Fajgelbaum, Pinelopi K. Goldberg, Patrick J. Kennedy and Amit K. Khandelwal’s 2020 article, “The Return to Protectionism,” in The Quarterly Journal of Economics; and Mary Amiti, Stephen J. Redding and David E. Weinstein’s 2019 article, “The Impact of the 2018 Tariffs on Prices and Welfare,” in Journal of Economic Perspectives.
- PCE price indexes do not discriminate between imported or domestic prices. In this way, the evolution of the different categories shown in the figure is only suggestive of some effects of tariffs on prices. By looking at categories with a high import content of Chinese goods affected by the tariffs, however, the hope is to uncover, informally, these effects.
- We stop our analysis in early 2020, leaving out the pandemic.


Citation
Maximiliano A. Dvorkin and Cassandra Marks, ldquoWhat Have We Learned from the U.S. Tariff Increases of 2018-19?,rdquo St. Louis Fed On the Economy, May 22, 2025.
This blog offers commentary, analysis and data from our economists and experts. Views expressed are not necessarily those of the St. Louis Fed or Federal Reserve System.
Email Us
All other blog-related questions