


Industry-Level Growth, AI Use and the U.S. Postpandemic Recovery
Output in the United States exhibited strong growth in 2023 and 2024, returning to its prepandemic trend. This comeback stands in contrast to the experience of many other countries—for example, output in Canada, the United Kingdom and the euro area still measures 4% to 6% below their respective prepandemic trends, as discussed in a May 2024 article by Francois de Soyres and others and a December 2024 article by Francois de Soyres and others.See the 2024 FEDS Notes articles, “Why is the U.S. GDP recovering faster than other advanced economies?” and “An investigation into the economic slowdown in the euro area,” published May 17 and Dec. 20, respectively. These authors argue that, relative to other countries, the United States has maintained higher rates of business dynamism.
In this blog post, we delve deeper into industry-level output per worker—our measure of productivity—and discuss how industry-level dynamics played into the postpandemic recovery. To calculate output per worker, we combined Bureau of Economic Analysis (BEA) value added by industry data with Bureau of Labor Statistics (BLS) Current Employment Statistics nonfarm employment estimates by industry.
We considered industries classified by two-digit NAICS codes. There are three goods-providing industries (construction, manufacturing and mining) and 16 service-providing industries. Ranked according to productivity, from highest to lowest, these 19 industries are: real estate, rental and leasing; utilities; mining; information; finance and insurance; wholesale trade; manufacturing; professional, scientific and technical services; management of companies; transportation and warehousing; construction; government; arts, entertainment and recreation; health care and social assistance; other services (such as repair and laundry); retail trade; educational services; administrative, support and waste management; and accommodation and food.
Growth within Industries Drove Productivity
First, we show that aggregate productivity growth since 2019 was not driven by employment reallocation toward the highly productive industries; rather, it was fueled by within-industry growth. To provide a broader perspective, the figure below shows employment shares by industry from the first quarter of 1997 to the third quarter of 2024. Industries are ranked according to their output-per-worker levels, with high productivity industries shown at the top of the graph.
The only notable trend is that the manufacturing employment share (shown in dark green) shrank over this period, while the service industries’ employment share—most notably health care (shown in orange)—expanded. Because manufacturing is relatively more productive, as shown in the figure, this long-run trend could not have fueled aggregate productivity growth since 1997. Moreover, we found no notable employment reallocation since 2019. While there was a sharp drop in the employment share in the accommodation and food industry during the 2020 shutdown, it has since returned to its prepandemic level.
Thus, we conclude that it was within-industry growth that fueled aggregate productivity dynamics during the entire period considered and, in particular, during the more recent period of exceptional postpandemic recovery.
Employment Share by Industry
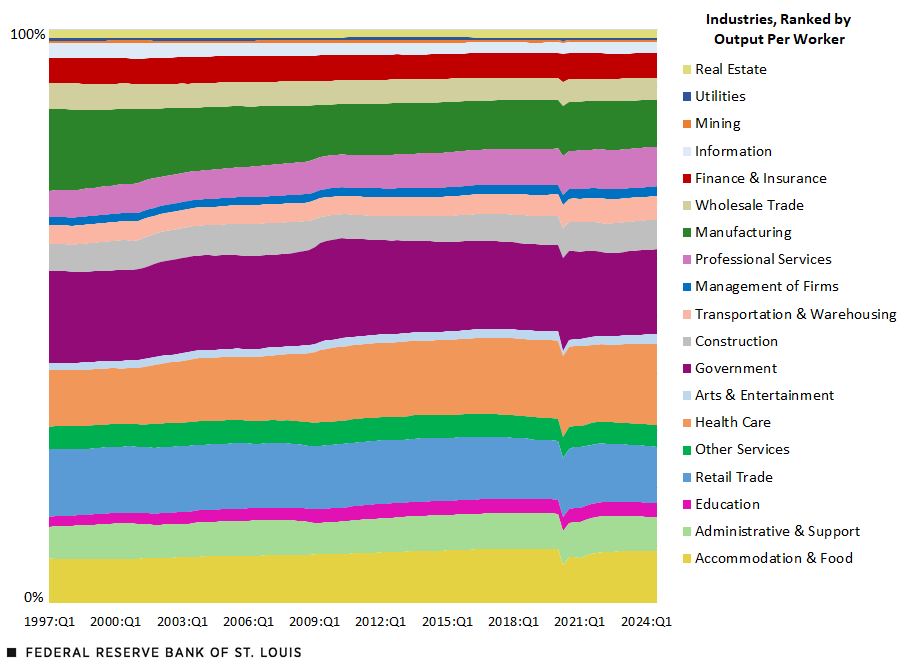
SOURCES: Bureau of Labor Statistics, Bureau of Economic Analysis and authors’ calculations.
Worker Education and AI Use Are Linked to Productivity Growth
Which industries led the way in terms of productivity growth, and what is special about them? We calculated industry-specific growth rates since 2019. We then illustrate how they relate to other industry-specific characteristics such as workers’ educational attainment and the prevalence of generative artificial intelligence (AI) use.
Consider the first figure below. Each point refers to one industry. Industry-specific productivity growth is shown on the x-axis, while the share of an industry’s workers who are college-educated appears on the y-axis. The highest productivity growth from the third quarter of 2019 to the third quarter of 2024 was in information, management of other companies, and mining. Output per worker in the information industry, for example, grew 30% over the course of five years (about 5% annual growth). By contrast, the construction industry grew the least; its productivity actually declined by 12% (that is, a negative 2.5% annual growth). It is clear there’s a positive relationship (as indicated by the slope of the fitted line) between sectoral education level and productivity growth in this period.
Positive Relationship between Industry Productivity Growth and Workers’ Education
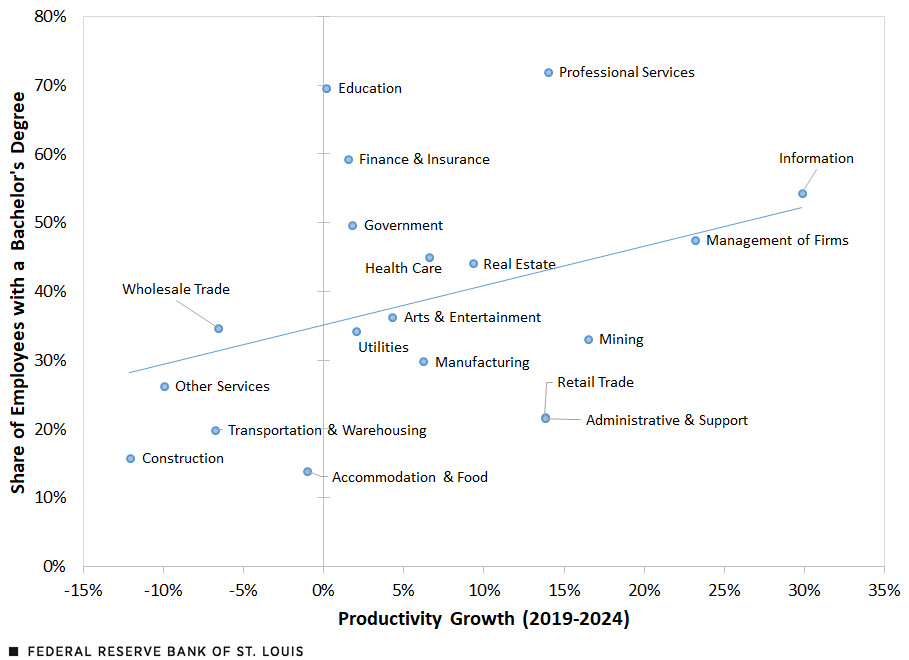
SOURCES: Current Population Survey, Bureau of Labor Statistics, Bureau of Economic Analysis and authors’ calculations.
NOTES: Productivity growth is the net growth rate of output per worker between the third quarter of 2019 and the third quarter of 2024. The industry-specific share of employees with a college degree is calculated using the 2024 Current Population Survey.
The figure below makes it clear that industry productivity growth is also positively related to the prevalence of AI use.See “The Rapid Adoption of Generative AI,” a 2025 National Bureau of Economic Research working paper by Alexander Bick, Adam Blandin and David J. Deming.
Industry Productivity Growth Shows a Connection to AI Use
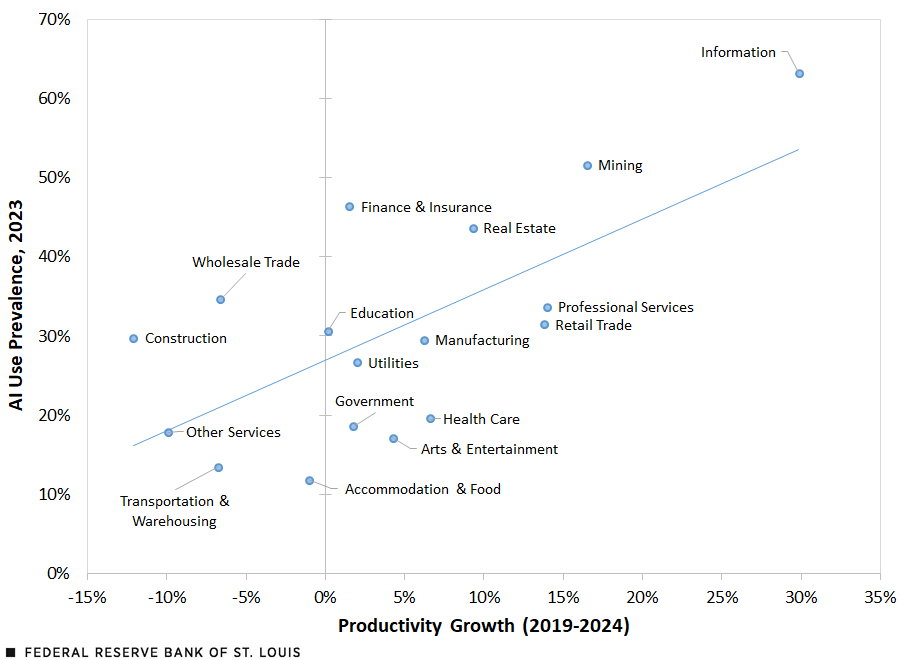
SOURCES: Bick, Blandin and Deming (2025), Bureau of Labor Statistics, Bureau of Economic Analysis and authors’ calculations.
NOTES: Productivity growth is the net growth rate of output per worker between the third quarter of 2019 and the third quarter of 2024. AI prevalence is the share of respondents who reported using generative AI in an industry; use data are not available for two industries: management of firms, and administrative and support.
As the figure shows, the use of AI took off during this time period. It is quite possible the industries that had more to gain from AI tools and had the educated workers who could effectively use them were the ones that experienced higher growth.
Note
- See the 2024 FEDS Notes articles, “Why is the U.S. GDP recovering faster than other advanced economies?” and “An investigation into the economic slowdown in the euro area,” published May 17 and Dec. 20, respectively.
- See “The Rapid Adoption of Generative AI,” a 2025 National Bureau of Economic Research working paper by Alexander Bick, Adam Blandin and David J. Deming.


Citation
Oksana Leukhina and Mickenzie Bass, ldquoIndustry-Level Growth, AI Use and the U.S. Postpandemic Recovery,rdquo St. Louis Fed On the Economy, May 13, 2025.
This blog offers commentary, analysis and data from our economists and experts. Views expressed are not necessarily those of the St. Louis Fed or Federal Reserve System.
Email Us
All other blog-related questions