


Who Trades More with China than with the U.S.?
Over the last few decades, the world has seen changes in the dynamics of global trade. Globalization has resulted in the increasing interconnectedness of economies worldwide. These changes have become more prominent in terms of the volume of trade between countries. In this blog post, we examine how much the U.S. and China dominate world trade and how that has evolved over the last two decades.
Trends in Global Trade
To study these dynamics, we look at bilateral trade data from UN Comtrade to compare countries’ trade volumes with the U.S. and China between 2002 and 2022. We begin by calculating annual total trade, defined as the sum of imports and exports, for each country in the dataset. We then restrict our sample for each year to the countries that together account for 90% of global trade in that year. By doing this, we focus our analysis on countries that are most integrated into the world economy.
For each country in our sample, we calculate total trade with the U.S., total trade with China and the ratio of trade with the U.S. to trade with China. Ratios greater than 1 signify that the U.S. is a bigger trading partner for that country than China. Ratios less than 1 signify that China is a bigger trading partner for that country than the U.S.
Changes in Trade Volumes of Countries over Time
To visualize these trends, we group countries based on their U.S.-China trade ratio. These categories show countries where U.S. trade dominates, where trade volumes are about equal, and where trade with China dominates.
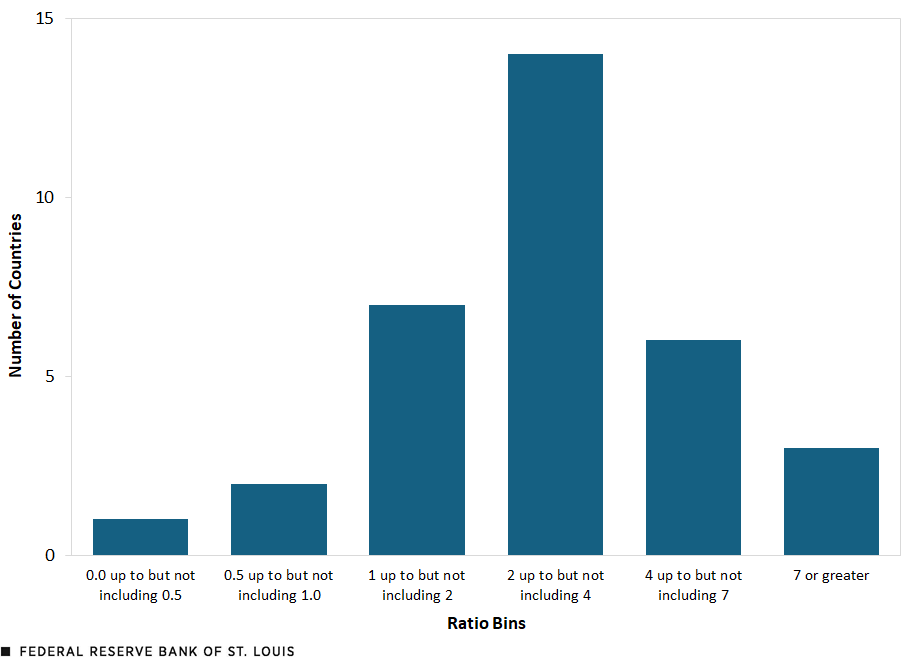
The figures below show the number of countries in each ratio bin for a sample of 33 countries in 2002 and a sample of 36 countries in 2022. Each bar represents how many countries fall into each category. In 2002, the trade ratio for 21 countries falls between 1 and 4, meaning most countries trade more with the U.S. than with China. However, in 2022, this relationship changes and the trade ratio for 25 countries falls under 1, meaning the majority now trade more with China than with the U.S. We see that China has surpassed the U.S. as the top trading partner for many countries.
Distribution of Countries’ U.S.-China Trade Ratios, 2002
Distribution of Countries’ U.S.-China Trade Ratios, 2022
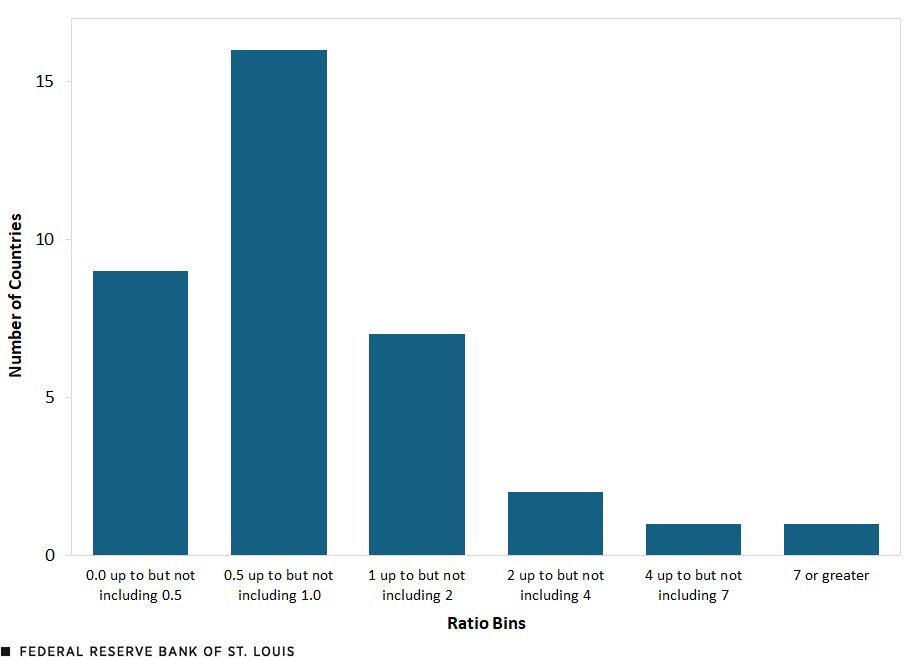
SOURCES FOR THE TWO FIGURES: UN Comtrade and authors’ calculations.
NOTES FOR THE TWO FIGURES: In 2002, there were three countries with ratios that exceeded 7: Canada, Mexico and Ireland. In 2022, only one country had a ratio that exceeded 7: Canada.
In 2002, the U.S. was the leading trading partner for seven countries: Brazil, Canada, Japan, Korea, Malaysia, Mexico and the U.K. China was the leading trading partner for Hong Kong. Two decades later, the U.S. was the leading trading partner for six countries: Canada, China, India, Ireland Mexico and the U.K. China, however, was the leading trading partner for 13 economies: Australia, Brazil, Germany, Hong Kong, Indonesia, Japan, Korea, Malaysia, Philippines, Singapore, South Africa, Thailand, and Vietnam.
Conclusion
In earlier years, most countries traded more with the U.S. than with China. Over time, China has become a more dominant trading partner, even among some of the world’s largest economies. A growing number of countries prioritizing China over the U.S. could have broader implications in diplomatic relations, infrastructure investments and regional trade agreements.


Citation
B. Ravikumar and Dawn Chinagorom-Abiakalam, ldquoWho Trades More with China than with the U.S.?,rdquo St. Louis Fed On the Economy, June 2, 2025.
This blog offers commentary, analysis and data from our economists and experts. Views expressed are not necessarily those of the St. Louis Fed or Federal Reserve System.
Email Us
All other blog-related questions