


Do Workforce Barriers Differ among Eighth District States?
Why are some people not engaged in the workforce, especially when they want to be? Understanding why this occurs is relevant to the Federal Reserve’s dual mandate of maximum employment and stable prices.For an insightful explanation of the Federal Reserve’s mandate on maximum employment, see Fed Governor Adriana Kugler’s remarks (PDF) on May 9, 2025.
In the first blog post in this two-part series, I showed that family responsibilities and health issues were key barriers preventing some people from looking for a job. That blog post explored national trends, but regional economies may face unique challenges. Today's blog post thus focuses on the seven states that make up the Federal Reserve’s Eighth District: Arkansas, Illinois, Indiana, Kentucky, Mississippi, Missouri and Tennessee.
I used micro data from the U.S. Census Bureau’s Current Population Survey (CPS) to identify workforce barriers in these Midwestern and Southern states. Specifically, the survey asks nonworking adults who want a job: What is the main reason you were not looking for work during the last four weeks?
There are 10 possible responses to the CPS question, including job-related reasons (e.g., “couldn’t find any work” and “other types of discrimination”), personal reasons (e.g., “can’t arrange child care” and “family responsibilities”) and transportation. If responses to the open-ended question cannot be put into one of these 10 reasons by the interviewer, they are grouped into an “other” category. Data from January 2022 to April 2025 were combined as a postpandemic period, during which the average unemployment rate had recovered to prepandemic levels. The sample was restricted to prime-age adults, ages 25 to 54, who were not current students, who were able to work, and who were not retired.The IPUMS CPS variable EMPSTAT (employment status) was used to filter out those who were not in the labor force due to being retired (code 36) or being unable to work (code 32). Note that code 32 corresponds to the response “not in labor force - disabled” in the unharmonized variable that IPUMS uses to create EMPSTAT (available via IPUMS CPS as UH_MLR_B3). Disabled survey respondents may also be in the workforce or may have selected not being in the labor force for other reasons (code 34).
The state-level data trends shown here can be used by communities in the Federal Reserve’s Eighth District to better-tailor strategies for addressing key workforce issues outlined below.
Family Responsibilities and Inability to Find Work Are Key Barriers in the Eighth District
In five of the seven Eighth District states, the most common response in the postpandemic period was family responsibilities; this response ranged from 22% to 36% of the weighted sample among all the District states. In the other two states, family responsibilities was the second most-listed response, indicating that this is a key barrier to looking for a job. In some states—Indiana and Tennessee, in particular—this has become a more frequent response than it was prepandemic (2016-19). In other states, notably Kentucky and Mississippi, it has become less frequent, though still sizable.
Primary Reason for Not Looking for Work in the Eighth District States, 2022-25
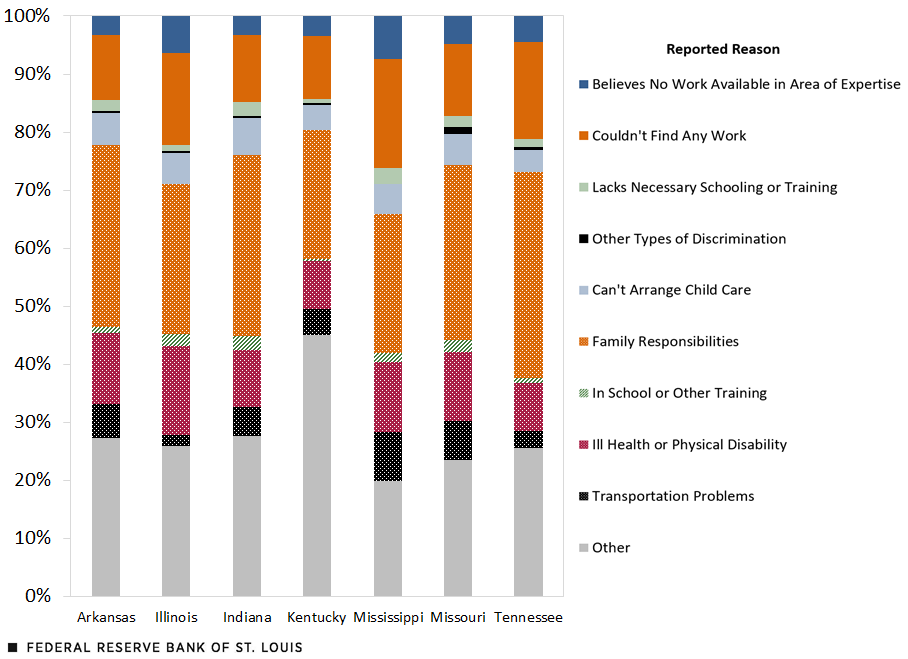
SOURCES: IPUMS CPS and author’s calculations.
NOTES: Data are pooled from January 2022 to April 2025. Responses are from adults ages 25 to 54 who had not actively looked for work in the past four weeks but wanted a job. The response “employers think person is too old or too young” was excluded because every District state had a response rate of 0%.
The second most-cited primary reason for staying out of the workforce was the catch-all “other” category, meaning that individuals’ reasons for not looking for work were quite varied and often not captured by the 10 main responses. In six of the Eighth District states, between 20% and 28% of adults’ responses had to be grouped in this category. The outlier was Kentucky, where it was the No. 1 reason: 45% of that state’s adults’ responses gave this reason.While “other” was the No. 1 response in Illinois, the difference between the response rate for “other” and for “family responsibilities”—the No. 2 response—was less than 0.2 percentage points. This is significant and suggests that additional insights could be gained by speaking to nonworkers in Kentucky or workforce development organizations.
The response “couldn’t find any work” was the third most-cited primary reason in every District state except for Arkansas, where the response “ill health or physical disability” was No. 3. “Couldn’t find any work” and “believes no work available in area of expertise” are job market-related reasons that, when combined, on average affected nearly 1 out of every 5 prime-age adults in this nonworking group. This is somewhat surprising given the recent tightness of the labor market relative to historical standards.
Child Care, Health Issues and Transportation
There were some other differences between states in the less frequently cited categories. For example, 7% of prime-age adults in Indiana who wanted a job were not currently looking because they had issues with arranging child care. This was about half as common in Tennessee. As outlined in my previous blog post, child care issues are a more common workforce barrier among mothers, particularly those with children younger than age 6.
Health issues also vary among the District states. As mentioned above, it was the third most-cited reason in Arkansas (12%), yet a larger share of adults in Illinois (15%) listed it as their main reason for not looking for work. Kentucky and Tennessee were at the lower end, at 8% each.
Finally, transportation issues are also more prevalent in some states compared with those in others. In Mississippi, 9% of nonworking adults listed this reason whereas in Illinois, only 2% did.Mississippi and Illinois did not differ, statistically speaking, though this was likely due to small sample sizes. Public transportation is more readily available in cities and metropolitan areas, which could mean states with larger rural populations could face a bigger transportation hurdle. Indeed, Illinois has a much smaller rural population than Mississippi. While the CPS sample size was not robust enough to test this trend at a state level, nationally, transportation issues were three times more likely in nonmetro areas than in metro city centers.
Conclusion
The vitality of the Eighth District’s economy is tied to the strength of its workforce. When workforce barriers are reduced or removed, local economies are able to rely on a more robust and resilient workforce to draw upon during difficult times. The information provided here could be useful to local workforce development organizations as they narrow in on what workforce barriers are prevalent in their communities.
Notes:
- For an insightful explanation of the Federal Reserve’s mandate on maximum employment, see Fed Governor Adriana Kugler’s remarks (PDF) on May 9, 2025.
- The IPUMS CPS variable EMPSTAT (employment status) was used to filter out those who were not in the labor force due to being retired (code 36) or being unable to work (code 32). Note that code 32 corresponds to the response “not in labor force - disabled” in the unharmonized variable that IPUMS uses to create EMPSTAT (available via IPUMS CPS as UH_MLR_B3). Disabled survey respondents may also be in the workforce or may have selected not being in the labor force for other reasons (code 34).
- While “other” was the No. 1 response in Illinois, the difference between the response rate for “other” and for “family responsibilities”—the No. 2 response—was less than 0.2 percentage points.
- Mississippi and Illinois did not differ, statistically speaking, though this was likely due to small sample sizes.

Citation
Ana Hernández Kent, ldquoDo Workforce Barriers Differ among Eighth District States?,rdquo St. Louis Fed On the Economy, July 8, 2025.
This blog offers commentary, analysis and data from our economists and experts. Views expressed are not necessarily those of the St. Louis Fed or Federal Reserve System.
Email Us
All other blog-related questions