


A Historical and Geographical Look at Federal Employment Levels
There has been considerable discussion about the amount of U.S. government spending and especially the magnitude of U.S. government debt over the years. While it is true that as recently as fiscal year 2001, there was a budget surplus, since then the federal government has consistently reported a deficit.
This deficit, which is the net effect of government spending exceeding its revenue from taxes and other income, has been exacerbated by major crises. In 2008-09, the U.S. had the financial crisis, and in 2020-21, the country experienced the COVID-19 pandemic. In each instance, substantial increases in government spending led to larger deficits. In fiscal year 2009, the budget deficit totaled $1.4 trillion and reached a peak of roughly $3.1 trillion in fiscal year 2020, according to the Congressional Budget Office. As recently as fiscal year 2024, it remained a substantial $1.8 trillion.
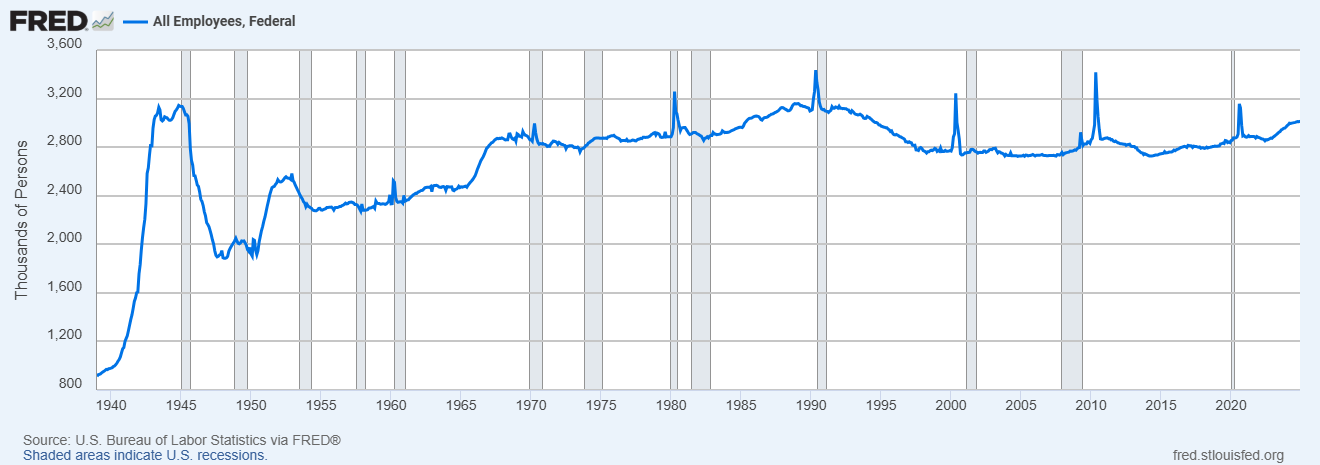
It’s easy to interpret the increase in the budget deficit as meaning the government itself has gotten larger. In terms of its budget and subsequent debt, that is certainly true. But in terms of the number of government employees, this isn’t quite as obvious. In the first figure, we plot federal employment from 1939 through 2024.
Absent the immediate aftermath of World War II and the Korean War, there is a consistent rise in federal employment extending through the 1980s. At this point, federal employment began to decline but has largely been flat throughout much of the 2000s. Exceptions include the decennial census hirings, which lead to short-lived spikes, and a rise in federal employment starting in late 2022. Still, as a percentage of the U.S. labor force, the share of federal workers stood at around 1.8% at the end of 2024 versus 2.5% at the end of 1989.
The Geography of Federal Employment
The growth (or decline, depending on the time frame) in federal employment could be based in the District of Columbia. This is intuitive since, for example, the departments of Education, Justice, Labor, Treasury, Agriculture, etc. are all based in the nation’s capital. This is not the case. Of the roughly 3 million people currently employed by the federal government, only about 190,000 are employed in the District of Columbia. The remaining 2.8 million are spread across every U.S. state.
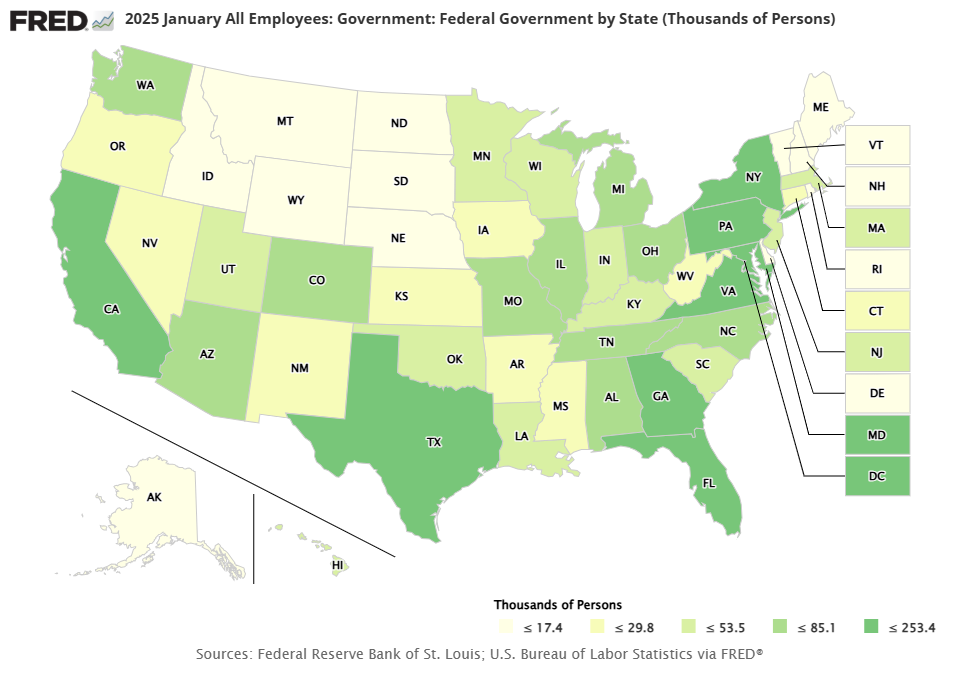
In the second figure, we provide a map of the U.S. that allows you to identify just how many federal employees were employed in each state as of January 2025 by hovering your cursor over a given state. The states with the largest number of federal jobs are California and Texas, with federal employment of 253,000 and 229,000, respectively. While the District of Columbia is physically small, its 193,000 is quite substantial relative to the federal workforce in less populated states like Vermont and Wyoming, with federal workers numbering 7,000 and 8,000, respectively.
Growth among States over Time
Note, however, that the current map is associated with federal employment as of January 2025. Historical data on state-level federal employment can be accessed by simply changing to the desired date when generating the map in FRED. This is useful if you want a subtler view of the growth in federal employment by state rather than in the aggregate. FRED has state-level data on federal employment going back to January 1990, which gives us the opportunity to identify any heterogeneity in federal employment growth across the states—in contrast to total federal employment being relatively stable since 1990.
Our own calculations indicate substantial variation in federal employment growth across the states. For example, the state with the highest growth rate in federal employment is Nevada, where the number of federal jobs rose roughly 90%, from 12,000 in January 1990 to nearly 23,000 in January 2025. Other states with growth of over 30% are West Virginia, North Carolina, Florida, Arizona and Vermont.
In total, 23 states saw growth in federal employment since January 1990. Twenty-six states and the District of Columbia experienced a decline in federal employment while Mississippi saw no change. The largest decrease occurred in New Jersey, where the number of federal workers tumbled roughly 38%, from 80,000 to 50,000. Other states with declines of over 25% were Illinois, Connecticut, New York and California.
Among the states at least partially connected with the district covered by the Federal Reserve Bank of St. Louis, none experienced a net growth in federal employment from January 1990 to January 2025. Kentucky, Missouri, Indiana, Tennessee, and Arkansas experienced declines in federal employment while Mississippi, as noted earlier, had the same number as it did in 1990.


Citation
Michael W. McCracken and Anna Cole, ldquoA Historical and Geographical Look at Federal Employment Levels,rdquo St. Louis Fed On the Economy, April 17, 2025.
This blog offers commentary, analysis and data from our economists and experts. Views expressed are not necessarily those of the St. Louis Fed or Federal Reserve System.
Email Us
All other blog-related questions