


Revisiting Wage Growth in 2023
In a 2022 blog post, we wrote about wage changes during that year. At the time, we noted that wage growth had increased since 2021 but was beginning to trend downward. A year later, we reexamine this topic to see how wage growth has evolved since then. As the U.S. economy continues to recover from the economic effects of the COVID-19 pandemic, we also compare wage growth, before and during the pandemic.
Measuring Nominal Wage Growth
Wages are an important component of production costs, and the evolution of nominal wages may be informative of inflationary pressures. However, there are different ways to measure wage inflation. A usual metric of wage inflation is the change in average hourly earnings for all private employees, as reported monthly by the Bureau of Labor Statistics (BLS). This measure has risen 4.0% from November 2022 to November 2023. The problem with this measure is that changes in the composition of the workforce may significantly impact the measure of inflation.
An alternative way to compute wage inflation is to look at the change in the wage of individual workers from one period to the next and then compute the average or the median across these changes. This way of measuring wage inflation is not affected by changes in the composition of the workforce but does require information on wages of the same individuals over time.
To further examine this topic, we used data from Homebase. Homebase is a private payroll company that collects data on the wages, hours and earnings of individual workers. We can track workers across time and businesses daily. This gives us an opportunity to calculate wage growth with greater frequency and flexibility. Rather than use the average hourly earnings from the BLS, which averages the wages of workers and then calculates the changes, we calculated the changes in wages by worker and then average the wage changes.
Visualizing Wage Growth
To help better understand wage growth evolution, we plotted the three-month moving average of the median year-over-year wage change, shown as the solid line in the figure below. We then compare our calculation to another measure of wage change—the Federal Reserve Bank of Atlanta Wage Growth Tracker.
The Atlanta Fed Wage Growth Tracker reports a measure of wage inflation. Using the Current Population Survey from the U.S. Census Bureau, it calculates the wage change of individual workers over time. The Atlanta Fed then reports the median of these changes each month. We look at its measure for hourly workers, shown as the dashed line in the figure below.
We can see that although the magnitude of the lines is not the same, the direction of the series is. This could be for several reasons:
- Homebase is not perfectly representative of the U.S. labor force; it contains a large portion of food and leisure workers. And Homebase does not include tips, so actual wages may be greater than reported wages.
- Homebase is not perfectly representative of U.S. firms; it primarily consists of small firms (firms with 50 or fewer employees), and small firms typically see smaller wage growth than larger firms.
Although the Homebase and Atlanta Fed wage change measures are different, they both tell the same story: Wage growth peaked in 2022 and has since come down, although not to pre-pandemic levels. Again, wages are still increasing, but at a slower rate.
The Evolution of Nominal Wage Growth
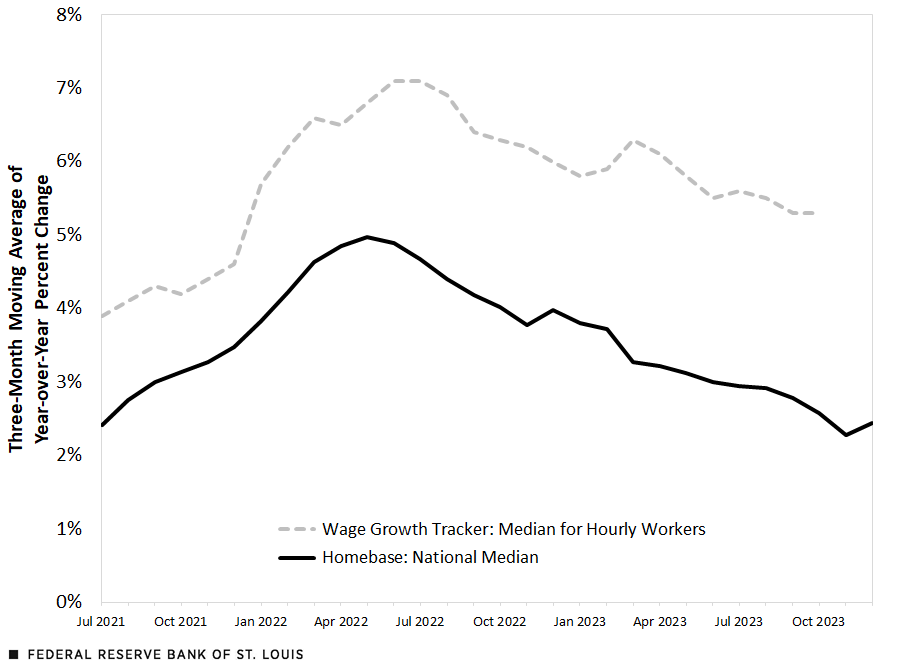
SOURCES: Homebase, Atlanta Fed and authors’ calculations.
A Closer Look at Wage Inflation
We now look more closely at wage changes across time and break our data into three periods: 2018-19, 2022 and 2023. For this, we used the Homebase data and limited our sample to U.S. workers who have been at the same company for at least one year. We also dropped workers with hourly wages that are less than $5, which leaves out some tipped employees whose tip income isn’t included in the Homebase data.
In addition to calculating wage changes at the individual level, we also varied the horizon of the change. We calculated wage changes at three horizons: annually, quarterly and monthly. For each of these frequencies, we calculated the mean percent change in wages and the median percent change in wages. We calculated wage changes for all workers and workers who received at least a 10-cent increase in their wage. We also reported the standard deviations.
Looking at the table, we can see that many of the wage changes follow a similar pattern: Wages grew fastest in 2022 and more slowly in 2023. For example, the average annual percent change for all workers was 4.6% from 2018 to 2019. This rose to 8.3% in 2022 and was 7.0% in 2023. So wages increased in 2023 compared with 2022, but at a slower pace. Overall, pandemic wage growth was still elevated above pre-pandemic wage growth, albeit slightly.
| 2018-19 | 2022 | 2023 | ||
|---|---|---|---|---|
| Annual Percent Change | Mean change, all workers | 4.6% | 8.3% | 7.0% |
| Median change, all workers | 0.0% | 4.4% | 3.0% | |
| Standard deviation, all workers | 7.6% | 11.3% | 9.8% | |
| Mean change, workers receiving a raise | 10.9% | 14.9% | 12.9% | |
| Median change, workers receiving a raise | 9.1% | 12.0% | 10.3% | |
| Standard deviation, workers receiving a raise | 7.4% | 10.4% | 9.1% | |
| Quarterly Percent Change | Mean change, all workers | 1.0% | 1.7% | 1.5% |
| Median change, all workers | 0.0% | 0.0% | 0.0% | |
| Standard deviation, all workers | 3.1% | 4.3% | 3.8% | |
| Mean change, workers receiving a raise | 6.8% | 7.8% | 7.0% | |
| Median change, workers receiving a raise | 5.9% | 6.5% | 5.9% | |
| Standard deviation, workers receiving a raise | 4.5% | 5.6% | 5.0% | |
| Monthly Percent Change | Mean change, all workers | 0.3% | 0.5% | 0.4% |
| Median change, all workers | 0.0% | 0.0% | 0.0% | |
| Standard deviation, all workers | 1.3% | 1.8% | 1.7% | |
| Mean change, workers receiving a raise | 4.3% | 4.7% | 4.3% | |
| Median change, workers receiving a raise | 3.6% | 3.9% | 3.5% | |
| Standard deviation, workers receiving a raise | 2.6% | 3.2% | 2.9% | |
| SOURCES: Homebase and authors’ calculations. | ||||
| NOTE: Workers receiving a raise are those who received at least a 10-cent increase in their hourly wage. | ||||
This same pattern holds for most of the reported mean and median wage changes over annual, quarterly and monthly horizons. An exception is quarterly and monthly median wage changes for all workers. The quarterly and monthly median wage changes are 0% for all three periods. This is because, for most individuals, wages change only once per year.
Another exception is the monthly median wage change for workers receiving a raise. In all other wage changes, the 2018-2019 wage growth was the smallest, 2022 wage growth was the largest, and 2023 wage growth was weaker than in 2022 but still stronger than pre-pandemic. However, at the monthly frequency, the median wage change for workers receiving a raise in 2023 was slightly lower than pre-pandemic wage growth.
By using individual-level data from Homebase, we can look at the evolution of wage changes at a greater frequency. This can help inform policy and employer decisions as the U.S. continues to navigate its economic recovery from the pandemic. The recent evolution in wage inflation at higher frequencies suggests that wage growth is returning to levels similar to the pre-pandemic period.


Citation
Maximiliano A. Dvorkin and Cassandra Marks, ldquoRevisiting Wage Growth in 2023,rdquo St. Louis Fed On the Economy, Jan. 8, 2024.
This blog offers commentary, analysis and data from our economists and experts. Views expressed are not necessarily those of the St. Louis Fed or Federal Reserve System.
Email Us
All other blog-related questions