


Millennials and Older Gen Zers Made Significant Wealth Gains in 2022
Younger families in the U.S. made remarkable gains in median wealth in 2022, according to our analysis of the latest Survey of Consumer Finances data.The SCF measures wealth at the household level. Households, or families, are grouped by the birth year of the survey respondent.
What did their wealth look like relative to where we expected it? In other words, how did their level of wealth compare with the estimated inflation-adjusted wealth held by all generations at the same age?For example, comparing the wealth of millennials with that of baby boomers—who have saved over a much longer period—isn’t very useful. A more insightful comparison is to examine the wealth of 35-year-old millennials with the predicted level of wealth that all generations had accumulated by the time their members were 35 years old. See the appendix for more details. We found that the median wealth of older millennials (those born between 1980 and 1989) was 37% above expectations. The wealth of younger millennials and older Gen Zers (those born between 1990 and 1999) was a similar 39% above expectations.
Millennial Wealth Grew Faster than Expected, Gaining Relative Ground
What makes the wealth numbers so notable is that they represent a sharp change from recent years.
Six years ago, we published a similar analysis using data from 1989 through 2016 in which we looked at how the Great Recession had impacted young families. As it turned out, older millennials had median wealth that was 34% below expectations in 2016 (which we have since revised to 38% given a slightly different method).
At the time, we wondered if these older millennials would be part of a “lost generation” financially, or if their wealth would eventually converge to that of other generations. Three years later, in 2019, they had begun to catch up to other generations, but their median wealth was still 11% below expectations (revised to 9% given the latest method).In addition to the new methodology, each year of additional survey data changes the estimates slightly. Both of these factors contributed to the different wealth deviations from past analyses.
As it turns out, older millennials experienced a sharp swing in their relative standing with median wealth expectations in 2022. Whereas for much of their adult lives, their wealth had been below where we would have expected it to be based on all generations at the same age, in 2022, their wealth was 37% above expectations—a 46 percentage point swing.
The figure below shows these changes, as well as deviations from median wealth expectations, for each SCF year (2007-22), organized by birth decade. At age 38, the average age of older millennials in 2022, our model predicted that the typical family would have about $95,000 in median wealth based on how all generations fared at the same average age. Instead, the typical older millennial had over $130,000. While there is wide variation within this group, the typical millennial born in the 1980s thus did better than we had expected. (In the appendix, see the methodology for further discussion on how these expectations were calculated.)
U.S. Families’ Median Wealth Was above Expectations in 2022
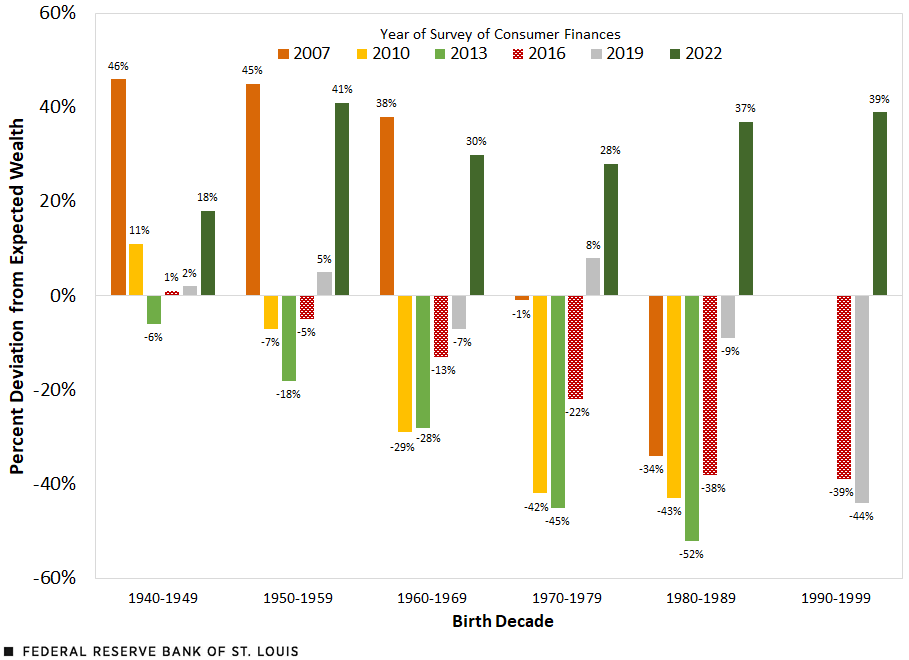
SOURCES: Federal Reserve Board’s Survey of Consumer Finances and authors’ calculations.
NOTES: The deviation represents the difference between inflation-adjusted median family wealth and wealth expectations, which were derived from the predicted best-fitting line to a life cycle of wealth based on all families. Estimates for the group born in the 1990s begin in 2016.
Those born in the 1990s—younger millennials and older Gen Zers—had an even sharper swing in wealth deviation from expectations between 2019 and 2022. Their wealth surged from 44% below expectations in 2019 to 39% above expectations in 2022—an 83 percentage point change.
In real terms, median wealth of these younger people more than quadrupled to $41,000 over this three-year period. Our estimates, based on a life-cycle model, accounted for the rapid growth in wealth accumulation that is typical for young families. That said, the actual rate of growth greatly exceeded expectations.
Real Estate Gains Largely Drove Overall Asset Growth
What might have propelled the wealth gains for younger generations?
Younger generations’ assets may reveal primary factors behind their extraordinary wealth growth. After all, the definition of wealth used here is the difference between assets and liabilities.
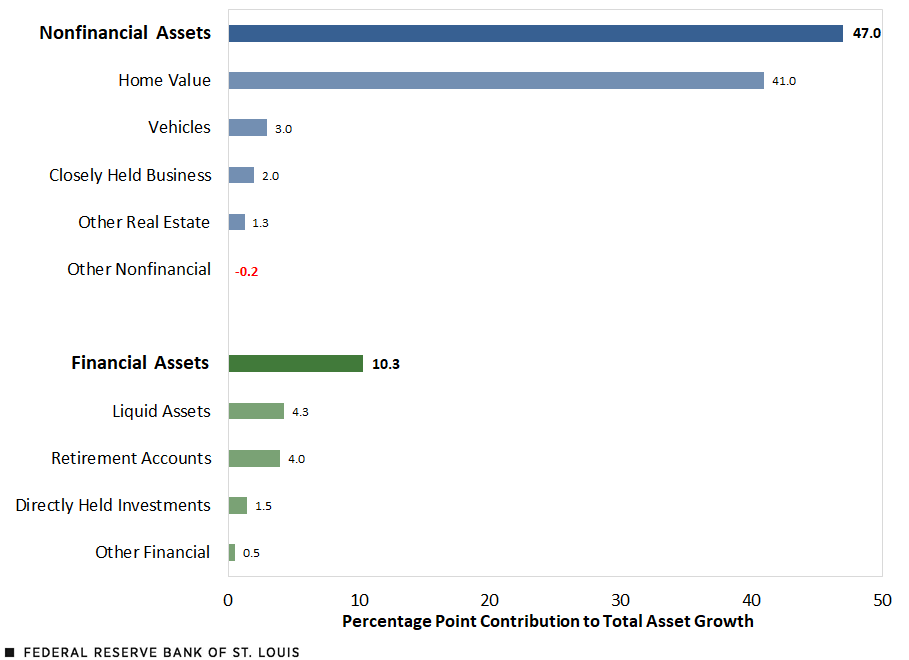
The figures below detail how the real value of different types of assets changed relative to total assets owned for those born in the 1980s and 1990s between 2019 and 2022. Fortunately, we can break down asset growth. Assets in the SCF fall into two key categories: nonfinancial (e.g., the value of a home or vehicle) and financial (e.g., the value of a checking account or 401(k)). Importantly, looking at the change in assets (rather than wealth, which includes debt) will favor growth in nonfinancial assets that may be debt-financed (e.g., a mortgage loan for a house or a loan for a car).While assets can significantly grow, wealth may be less changed given a coincident rise in liabilities. That said, the conclusions remain largely the same when looking at the change in net worth, rather than assets.
Between 2019 and 2022, the subset (middle of the wealth distribution) of total assetsFor this analysis, we restrict the sample to those households which held total assets valued between the 25th and 75th percentile of the asset distribution. Wealth in the U.S. is highly skewed, with those at the top owning a large share of the assets. Thus, looking at the middle of the distribution allows us to better pinpoint why the median grew. Those thresholds are unique to each birth cohort and survey year combination. We estimate the percentage change based on the total value of assets held by these groups (rather than a median or mean statistic). held by those born in the 1980s grew 57.3% in real terms. As shown in the second figure, nonfinancial assets and financial assets contributed 47 percentage points and 10.3 percentage points, respectively, to the total asset growth of 57.3%. When examining the individual components rather than key category, the bulk of that growth (41 percentage points) came from the increased value of housing assets.
During that same period, the subset of total assets held by those born in the 1990s jumped 238.8% in real terms, of which nonfinancial assets and financial assets contributed 190.6 percentage points and 48.1 percentage points, respectively, to overall growth. As shown in the third figure, roughly half of that growth (127.8 percentage points) came from housing assets.
As both figures show, housing assets drove most of the overall growth; this is consistent with separate analysis of wealth gains by race and ethnicity.
In the next two paragraphs, before the figure, the percentage point changes and percentages were corrected on May 31, 2024.What drove this increase in the real value of housing assets? Between 2019 and 2022, the homeownership rate jumped 7 percentage points, from 53.5% to 60.5%, for the group born in the 1980s.* Similarly, the rate for the cohort born in the 1990s jumped 11 percentage points, from 27.8% to 38.8%.* Over this period, home prices also appreciated considerably; therefore, the homes owned by these groups may have gone up in value since they were purchased, driving both home equity and wealth higher. And, while they’re not growing as fast as housing assets, liquid assets and retirement accounts also increased between 2019 and 2022.
Vehicle-related assets were also an important factor for the group born in the 1990s. As with homes, this is reflected in higher ownership rates: The share of families in this group that owned a vehicle jumped about 5 percentage points, from 78.7% to 83.9%.* In the following sentence, the description of the change in vehicle ownership rates was corrected on May 31, 2024.Vehicle ownership rates were effectively unchanged for those born in the 1980s.*
The Contributions of Key Asset Categories and Their Components to Total Asset Growth (2019-22) for Those Born in the 1980s
The Contributions of Key Asset Categories and Their Components to Total Asset Growth (2019-22) for Those Born in the 1990s
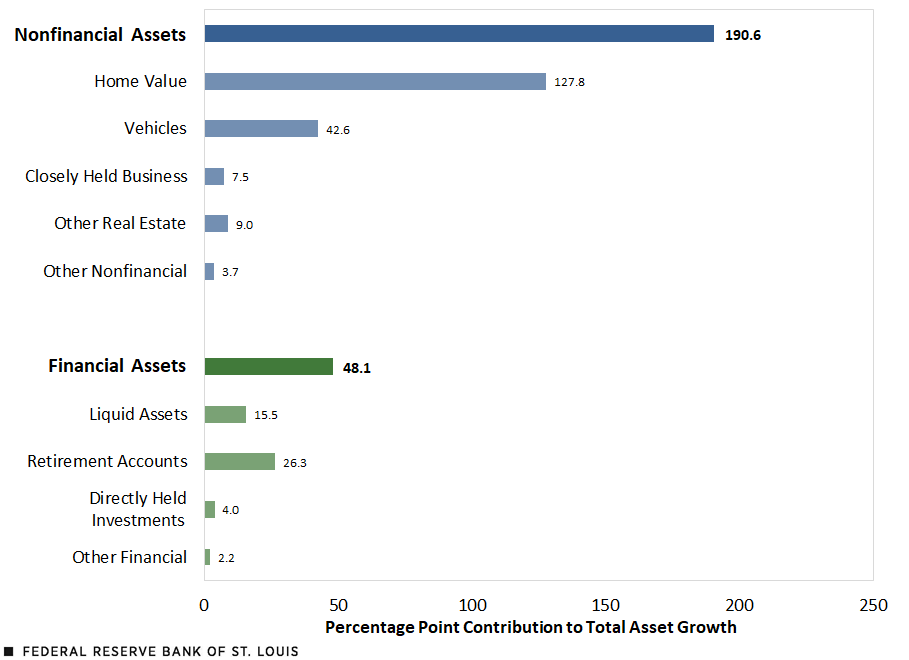
SOURCES FOR BOTH FIGURES: Federal Reserve Board’s Survey of Consumer Finances and authors’ calculations.
NOTES FOR BOTH FIGURES: These figures look at the change in total assets for households in the middle of their cohort’s respective wealth distribution (between the 25th and 75th percentile). All values have been adjusted for inflation. The values of homes and vehicles are based on market value; those for closely held business and other types of real estate are based on net equity; the value of liquid assets equals the value of checking and savings accounts, certificates of deposit, savings bonds and prepaid cards; the value of retirement accounts encompasses IRAs, Keough accounts, and other pension accounts where withdrawals or loans may be taken (e.g., 401(k) accounts). The value of directly held investments sums the market value of equities, bonds, mutual funds and other money market mutual funds, and hedge funds.
2022 Was a Stellar but Unusual Year for Generational Wealth
Is this pace of wealth growth sustainable? Since the Federal Reserve began the contemporary form of the triennial survey in 1989, in no other time period did deviations from expectations shift so much as in 2019 to 2022, with the exception of the Great Recession (reflected in the comparison of the 2007 to 2010 survey years, in which wealth fell considerably). Thus, the period between 2019 and 2022 was quite unusual in terms of wealth growth.
This unusual growth wasn’t experienced by only this younger generation. As reflected in the first figure, other generations also experienced strong gains: The median wealth of families headed by respondents born in the 1940s through the 1990s exceeded wealth expectations by 18% to 41% in 2022. The typical families of these generations were thus doing better than expected in terms of wealth. (This recent post shows growth and distribution of wealth among other demographic groups.)
When it comes to the younger generations, it’s unclear if millennials’ and older Gen Zers’ rapid wealth gains will continue. Since 2022, data from other surveys and sources have shown a financial softening. For example, savings and checking account balances have declined across racial, ethnic and income groups.
Yet young families who experienced wealth increases may be able to achieve more long-term growth by saving and investing to take advantage of price appreciation and compound interest. Indeed, as the analysis of asset growth showed, these generations have acquired assets like homes and financial investments for which further appreciation is possible. To the extent that such growth is widespread and equitable, it could have positive impacts on the economy through greater consumption and innovation.
*Editor's Note: This post was updated on May 31, 2024, to correct the percentage point changes and the homeownership rates for those born in the 1980s and for those born in the 1990s; the percentage point change and the vehicle ownership rates for those born in the 1990s; and the description of the change in vehicle ownership rates for those born in the 1980s. The corrected numbers and description are in bold.
Notes
- The SCF measures wealth at the household level. Households, or families, are grouped by the birth year of the survey respondent.
- For example, comparing the wealth of millennials with that of baby boomers—who have saved over a much longer period—isn’t very useful. A more insightful comparison is to examine the wealth of 35-year-old millennials with the predicted level of wealth that all generations had accumulated by the time their members were 35 years old. See the appendix for more details.
- In addition to the new methodology, each year of additional survey data changes the estimates slightly. Both of these factors contributed to the different wealth deviations from past analyses.
- While assets can significantly grow, wealth may be less changed given a coincident rise in liabilities. That said, the conclusions remain largely the same when looking at the change in net worth, rather than assets.
- For this analysis, we restrict the sample to those households which held total assets valued between the 25th and 75th percentile of the asset distribution. Wealth in the U.S. is highly skewed, with those at the top owning a large share of the assets. Thus, looking at the middle of the distribution allows us to better pinpoint why the median grew. Those thresholds are unique to each birth cohort and survey year combination. We estimate the percentage change based on the total value of assets held by these groups (rather than a median or mean statistic).
Methodology
The relationship between median household net worth and age constitutes the life cycle of median wealth. A best-fit curved line was produced of predicted, or expected, median wealth for each age, based on all observations for households that responded to the triennial Survey of Consumer Finances from 1989 to 2022 (respondents were born between 1897 and 2004). Estimates are calibrated with 2019, the year before the COVID-19 pandemic, as the reference year; we used 2019 rather than 2022 because 2022 was such an unusually high wealth year. Real, or inflation-adjusted, median wealth for each group is then compared with predicted wealth based on the average age of each group. All estimates use weights to both adjust for those households that didn’t respond to the survey and to make the estimates representative of the U.S. household population.


Citation
Ana Hernández Kent and Lowell R. Ricketts, ldquoMillennials and Older Gen Zers Made Significant Wealth Gains in 2022,rdquo St. Louis Fed On the Economy, Feb. 26, 2024.
This blog offers commentary, analysis and data from our economists and experts. Views expressed are not necessarily those of the St. Louis Fed or Federal Reserve System.
Email Us
All other blog-related questions