


The Labor Effects of Work from Home on Workers with a Disability
In the United States, 9.5% of individuals ages 25 to 54 had a disability, according to 2022 census data. Due to a variety of factors, including an array of job barriers they may face, these individuals tend to have lower wages, a lower rate of labor force participation and a higher rate of unemployment. Work from home (WFH) has the potential to improve labor market outcomes for workers with a disability.
In fact, remote work has already opened up more jobs to individuals with disabilities, as noted by the National Disability Institute. In a 2022 statement, Thomas Foley, the institute’s executive director, said flexible employment arrangements “reduce multiple barriers, increase productivity and allow us to add value to our organizations and our shared national workforce.”
In this blog post, we examine recent trends in the WFH rate for workers with and those without a disability. We also look at how wages, unemployment, hours and labor force participation have changed in recent years relative to the pre-pandemic period.
Trends in Work from Home
To look at the evolution of work-from-home rates, we used data from the U.S. Census Bureau’s American Community Survey (ACS). We limited our sample to prime-age (ages 25 to 54) individuals.
For the purpose of this post, an individual with a disability is anyone who answers positively to whether they have any of the six disability categories tracked by the ACS. These include ambulatory, cognitive, hearing, seeing, self-care, or independent living disabilities. We count an individual as WFH if they claim that their primary means of transportation to work is to “work at home.”
The figure below shows the evolution of WFH rates since 2010. Before the pandemic, workers with a disability and those without a disability had similar rates. The WFH rate increased substantially for both types of workers at the start of the pandemic in 2020. However, the rate increased more for workers without a disability than for workers with a disability. This might be due to compositional effects; WFH was more likely in certain occupations and industriesFor more information on the type of occupations whose work can be done at home, see Jonathan I. Dingel and Brent Neiman’s 2020 working paper “How Many Jobs Can Be Done at Home?” in which workers with a disability might be underrepresented. In 2022, both WFH rates decreased relative to 2021, although they remained substantially elevated relative to their pre-pandemic levels.
The Evolution of Work-from-Home Rates
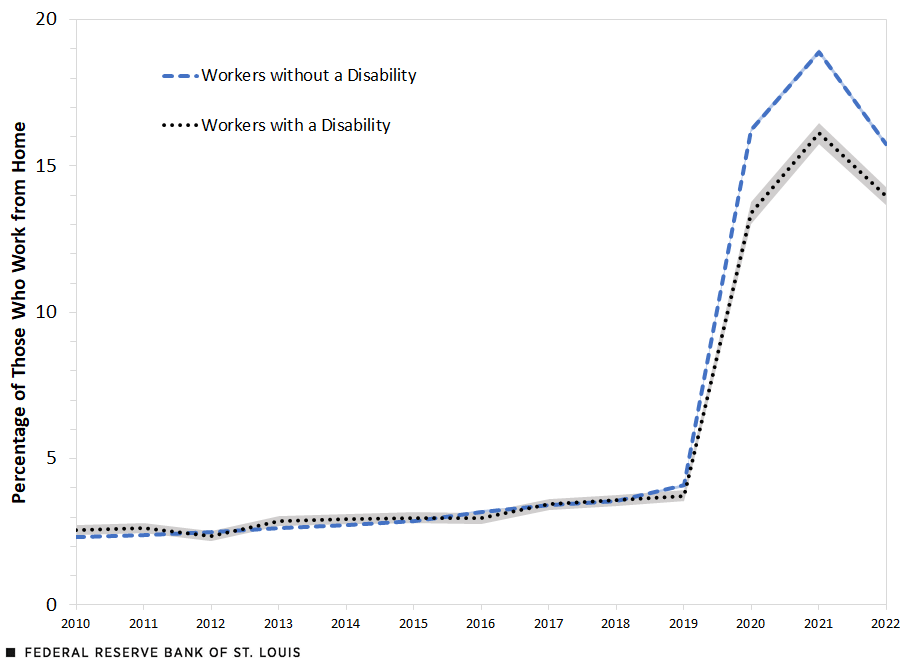
SOURCES: American Community Survey and authors’ calculations.
NOTE: The shaded area represents the standard errors around the data; the standard errors for the share of workers without a disability are very small due to the large sample size and thus imperceptible in the figure.
Effects on Labor Force Participation, Unemployment and Wages
The increase in WFH was broad based, and the composition of workers who work from home changed substantially. Specifically, many high-income workers in certain sectors were now able to work from home.Dingel and Neiman, 2020.
Unfortunately, in our data, we cannot see who changed their work-from-home status before and after the start of the pandemic. We only see an individual at one period in time and their current labor market status. Therefore we cannot tell whose labor market outcomes changed and whether WFH was the underlying cause. This limits our analysis to examining aggregate changes in WFH rates. However, we can still look at how the gaps in the labor force participation rate, the unemployment rate, and the wages and hours worked have changed from before the pandemic to after the start of the pandemic for workers with and those without a disability.
The first table below shows how the mean of each variable has changed from before the pandemic (2010-19) to after the start of the pandemic (2021-22) for workers with a disability and those without a disability. The second table shows the pre-pandemic and pandemic gaps between the two groups for each variable. We adjusted all numbers for education, sex and age.
Before the pandemic, workers with a disability had much lower rates of labor force participation (38 percentage points lower) and much higher rates of unemployment (9 percentage points higher) than workers without a disability. (See the second table.)
While these gaps remain large, they narrowed during the pandemic; the changes are shown in the first table. The labor force participation rate increased 6.5 percentage points for workers with a disability while it actually decreased slightly for all other workers. Similarly, the unemployment rate declined 4.0 percentage points for workers with a disability and only 1.3 percentage points for workers without a disability.
Turning to wages, we can see that the average hourly wage increased more for workers with a disability (6.3% growth) than for workers without a disability (3.7% growth), narrowing the wage gap by 2.6 percentage points. However, interestingly, for WFH workers, wage gap narrowed even more. WFH workers with a disability saw a 17% increase in their wages while WFH workers without a disability saw an increase in average wages of about 12%. Thus, for WFH workers, the wage gap narrowed by 5.9 percentage points.
Before the pandemic, there was a large gap in usual hours worked between workers with a disability and workers without a disability; those with a disability worked about 2.5 hours less per week. One possibility is that WFH allows for this gap to narrow, as those with a disability don’t have to face a difficult commute and do have more control over their workspace. This is exactly what happened. For the group of WFH workers, the gap in hours closed substantially during the pandemic. Average weekly hours increased by 2.7 for WFH workers with a disability versus only 0.3 for WFH workers without a disability.
| Labor Force Participation Rate (Percentage Points) | Unemployment Rate (Percentage Points) | Usual Weekly Hours | Usual Weekly Hours, Work from Home | Average Hourly Wages | Average Hourly Wages, Work from Home | |
|---|---|---|---|---|---|---|
| Change for Workers with a Disability | 6.5 | -4.0 | 0.7 | 2.7 | 6.3% | 17.4% |
| Standard error | 0.09 | 0.08 | 0.04 | 0.14 | 0.23 | 0.89 |
| Change for Workers without a Disability | -0.4 | -1.3 | -0.2 | 0.3 | 3.7% | 11.5% |
| Standard error | 0.03 | 0.02 | 0.01 | 0.03 | 0.05 | 0.19 |
| Labor Force Participation Rate (Percentage Points) | Unemployment Rate (Percentage Points) | Usual Hours | Usual Hours, Work from Home | Average Hourly Wages | Average Hourly Wages, Work from Home | |
|---|---|---|---|---|---|---|
| Pre-Pandemic Gap | -38.2 | 9.2 | -2.5 | -3.0 | -18.4% | -24.1% |
| Standard error | 0.04 | 0.04 | 0.02 | 0.11 | 0.11 | 0.68 |
| 2021-2022 Gap | -31.4 | 6.5 | -1.6 | -0.7 | -15.8% | -18.2% |
| Standard error | 0.00 | 0.00 | 0.03 | 0.09 | 0.00 | 0.01 |
| SOURCES FOR BOTH TABLES: American Community Survey and authors’ calculations. | ||||||
| NOTES FOR BOTH TABLES: Pre-pandemic period is 2010-19; pandemic period is 2021-22. We do not include 2020 in our regressions due to experimental weights. | ||||||
Conclusion
The fairly recent increase in the availability of work from home has the potential to greatly narrow existing labor market gaps between workers with a disability and those without a disability. As the labor market remains tight, many firms are looking for ways to expand their pool of potential employees. Using WFH to accommodate workers with disabilities is one possible avenue.
Notes
- For more information on the type of occupations whose work can be done at home, see Jonathan I. Dingel and Brent Neiman’s 2020 working paper “How Many Jobs Can Be Done at Home?”
- Dingel and Neiman, 2020.


Citation
Cassandra Marks and Hannah Rubinton, ldquoThe Labor Effects of Work from Home on Workers with a Disability,rdquo St. Louis Fed On the Economy, Feb. 27, 2024.
This blog offers commentary, analysis and data from our economists and experts. Views expressed are not necessarily those of the St. Louis Fed or Federal Reserve System.
Email Us
All other blog-related questions