Convergence or Divergence? A Look at GDP Growth across Richer and Poorer Countries
Real national income per person or, equivalently, real gross domestic product (GDP) per capita is a popular measure of economic development. Typically, higher levels of GDP per capita are associated with higher standards of living. For example, in 2022, the U.S. had a GDP per capita of $76,320, while Cameroon, a less developed economy, had a GDP per capita of only $1,500.
Cross-country Convergence in GDP Per Capita
While many countries have seen an increase in GDP per capita since the 19th century, economist Lant Pritchett noted that from 1870 to 1990 “the difference in income between the richest country and all others has increased by an order of magnitude.”See Pritchett’s article, “Divergence, Big Time,” in the summer 1997 issue of the Journal of Economic Perspectives. This divergence in national income runs contrary to the convergence hypothesis, which economists Paul Johnson and Chris Papageorgiou described as follows:
“The hypothesis in its simplest form states that initial conditions have no implications for a country’s per capita income level in the long run. In practice, the hypothesis is often taken to mean that per capita incomes in different countries are getting closer to each other in some sense, which implies that poorer countries are catching up with richer countries.”See Johnson and Papageorgiou’s March 2020 Journal of Economic Literature article, “What Remains of Cross-country Convergence?”
The convergence hypothesis stems from the notion of diminishing returns. If the accumulation of factors such as physical capital or knowledge is subject to diminishing returns, then richer countries with their abundance in capital would accumulate them at a slower rate and grow more slowly relative to poorer countries.
To see the lack of convergence, we calculated the GDP per capita of the U.S., one of the richest countries in the world. We then calculated the ratio of the GDP per capita for the rest of the world to that of the U.S. We refer to this ratio as relative GDP per capita. Between 1960 and 1999, GDP per capita showed no signs of convergence. The average GDP per capita of the rest of the world remained roughly constant at 27% of that of the U.S. during this period. Starting in 2000, however, the rest of the world began to close the gap with the U.S. By 2010, the relative GDP per capita peaked at around 35%. For the rest of the world to close the gap with the U.S., other countries must be growing faster.
Change in the Relationship between Growth Rate and Level of GDP Per Capita
To better understand the lack of convergence before 2000 and the closing gap since 2000, we used disaggregated data at the country level instead of aggregating them to “the rest of the world.”
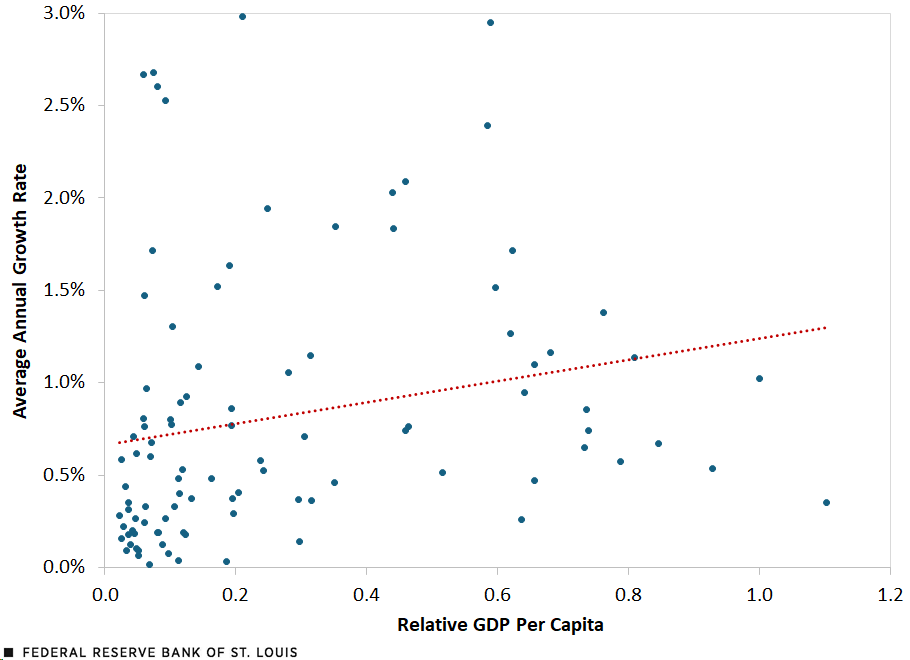
The figure below shows the average annual growth rate of GDP per capita and relative GDP per capita for a sample of more than 100 countries. From 1960 to 1999, there is a positive relationship. Countries with higher relative GDP per capita also have higher average annual growth rates. This suggests divergence, not convergence, in the standard of living. Richer countries grew faster than poorer ones, increasing the disparity over time.
Average Annual Growth Rate of GDP Per Capita versus Relative GDP Per Capita, 1960-1999

SOURCES: Penn World Tables 10.0 and authors’ calculations.
NOTES: The average annual growth rate is the time-series average of annual growth rates in per-capita GDP for each country for each year between 1960 and 1999. Relative GDP per capita is the ratio of per-capita GDP of each country to that of the U.S. We excluded countries with an average annual growth rate above 3% to understand this spread more carefully. The dotted line shows the best linear fit between the variables. There are 12 countries in the 1960-99 sample that exceed the growth rate of 3%. The best linear fit is positively sloped even if we include the 12 countries.
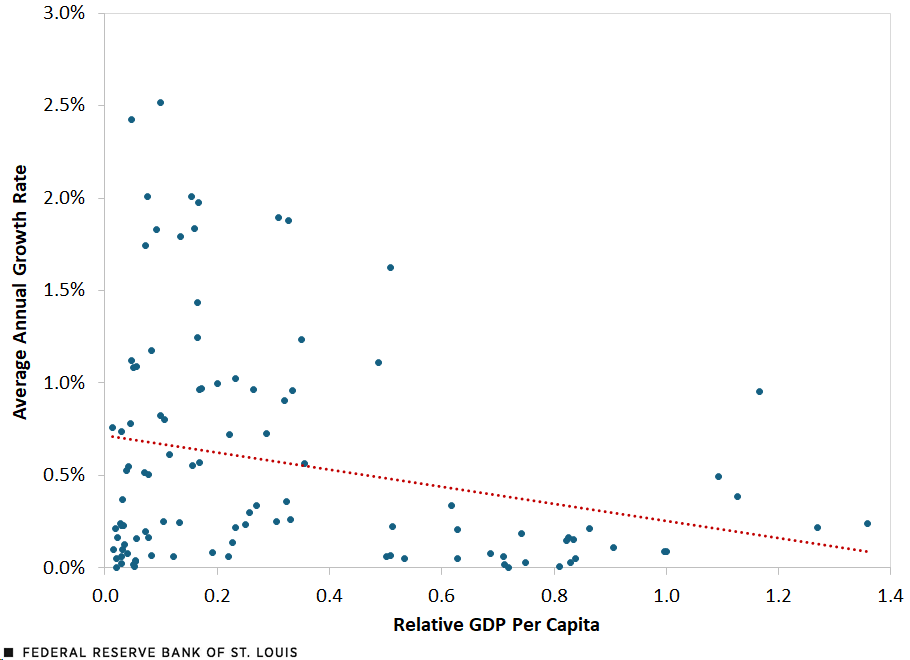
After 1999, the relationship between the growth rate and level of GDP per capita looks different. The following figure plots the average annual growth rate of GDP per capita versus relative GDP per capita for a similar sample of more than 100 countries, from 2000 to 2019. There is a negative relationship between the average annual growth rate and relative GDP per capita since 2000. This suggests convergence, meaning that poorer countries grew faster than richer ones, implying that the former will tend to catch up over time.Dev Patel, Justin Sandefur and Arvind Subramanian pointed out in their October 2018 Vox EU article, “Everything You Know about Cross-country Convergence Is (Now) Wrong,” that the convergence in the recent period “isn’t just about the growth slowdown in rich countries.”
Average Annual Growth Rate of GDP Per Capita versus Relative GDP Per Capita, 2000-2019

SOURCES: Penn World Tables 10.0 and authors’ calculations.
NOTES: The average annual growth rate is the time-series average of annual growth rates in per-capita GDP for each country for each year between 2000 and 2019. Relative GDP per capita is the ratio of per-capita GDP of each country to that of the U.S. We excluded countries with an average annual growth rate above 3% to understand this spread more carefully. The dotted line shows the best linear fit between the variables. There are four countries in the 2000-19 sample that exceed the growth rate of 3%. The best linear fit is negatively sloped even if we include the four countries.
Conclusion
This article reveals that the relationship between the growth rate and level of GDP per capita has changed since 2000 compared with the years between 1960 and 1999. In the earlier period, richer countries grew faster than poorer ones. Today, poorer countries have higher growth rates and are catching up to the U.S., thereby reducing the disparity between nations.
Notes
- See Pritchett’s article, “Divergence, Big Time,” in the summer 1997 issue of the Journal of Economic Perspectives.
- See Johnson and Papageorgiou’s March 2020 Journal of Economic Literature article, “What Remains of Cross-country Convergence?”
- Dev Patel, Justin Sandefur and Arvind Subramanian pointed out in their October 2018 Vox EU article, “Everything You Know about Cross-country Convergence Is (Now) Wrong,” that the convergence in the recent period “isn’t just about the growth slowdown in rich countries.”
Citation
B. Ravikumar, Dawn Chinagorom-Abiakalam and Amy Smaldone, ldquoConvergence or Divergence? A Look at GDP Growth across Richer and Poorer Countries,rdquo St. Louis Fed On the Economy, Aug. 19, 2024.
This blog offers commentary, analysis and data from our economists and experts. Views expressed are not necessarily those of the St. Louis Fed or Federal Reserve System.
Email Us
All other blog-related questions


