


How the Big Mac Index Relates to Overall Consumer Inflation
The Big Mac index was created by The Economist magazine as an informal way of measuring the purchasing power parity between different countries and currencies. The idea is that in every country, the Big Mac sold at McDonald’s is the same. The price of the Big Mac should reflect the local price of ingredients, wages and other expenses like advertising. Therefore, even though the Big Mac sandwich is the same in every country, its price differs.
Many people use the Big Mac index to roughly gauge the relative strength of foreign exchange rates. But does this price index also reflect a country’s inflationary pressures? In this blog post, we compare U.S. data from the Big Mac index to the U.S. consumer price index (CPI) for all items, which is the headline price index number that gets reported in the media.
The Big Mac and the CPI
In the figure below, we plot biannually the price of the Big Mac and the CPI, which are normalized to 100 in January 2012.
As we can see, since 2012, the indexed price of the Big Mac has been above the CPI, but the two move similarly. However, when inflation started to take off in 2021, the price of the Big Mac did not increase as fast as the CPI.
The Big Mac Index and the CPI

SOURCES: The Economist, U.S. Bureau of Labor Statistics (via Haver Analytics) and authors’ calculations.
NOTE: Data are for January and July of each year.
Inflation Comparison
To see how the change in the price of the Big Mac and the change in the CPI are related, we calculated recent annual inflation rates, which we will call Big Mac inflation and CPI inflation, respectively. We plot both inflation rates biannually since 2018 in the figure below.
Big Mac Inflation vs. CPI Inflation
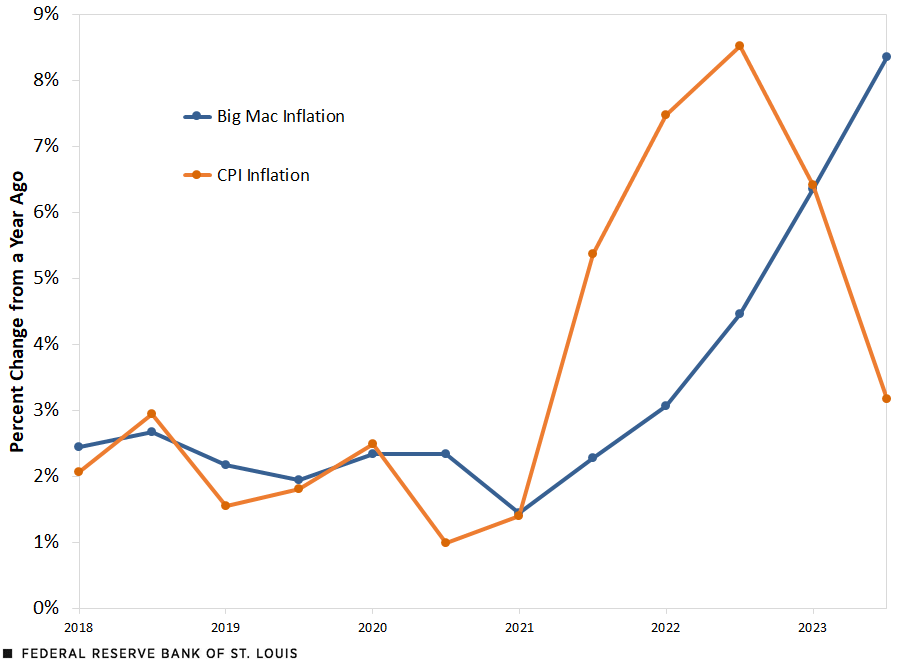
SOURCES: The Economist, U.S. Bureau of Labor Statistics (via Haver Analytics) and authors’ calculations.
NOTE: Data are for January and July of each year.
From January 2018 to January 2021, the two inflation rates move similarly, with both being around 2%. After January 2021, CPI inflation and Big Mac inflation started to diverge, with CPI inflation being higher than Big Mac inflation through January 2023.
CPI inflation reached a peak of 8.5% in July 2022, whereas Big Mac inflation increased at a slower pace and had reached only 4.5% when CPI inflation peaked. Since then, Big Mac inflation has still been increasing, whereas CPI inflation has started to decrease.
Why is the Big Mac index not reflecting the overall changes in CPI?
Food in the CPI Calculation
There are many different components of the CPI—from energy to shelter to clothing. The change in the price of the Big Mac closely follows the change in prices associated with food away from home.Prices associated with eating at restaurants and other establishments are reflected in the food away from home price index, which is part of the CPI. Both the food away from home price index and the Big Mac index had larger increases than the CPI for all items after July 2022.
While the two most volatile components of the CPI are food and energy, the subcomponent food away from home represents only 5.4% of the overall CPI using 2022 weights. Though Big Mac inflation does seem to track CPI inflation, its path can diverge from overall inflation because of price deviations relative to other goods and services in the U.S. consumer basket.
Note
- Prices associated with eating at restaurants and other establishments are reflected in the food away from home price index, which is part of the CPI.


Citation
B. Ravikumar and Amy Smaldone, ldquoHow the Big Mac Index Relates to Overall Consumer Inflation,rdquo St. Louis Fed On the Economy, April 11, 2024.
This blog offers commentary, analysis and data from our economists and experts. Views expressed are not necessarily those of the St. Louis Fed or Federal Reserve System.
Email Us
All other blog-related questions