


Commercial Real Estate Exposure and Bank Stock Returns
The COVID-19 pandemic induced social and economic changes, such as accelerating the shift to work from home and e-commerce, that have downgraded the future prospects for office buildings and shopping centers. As a result, debt backed by commercial real estate (CRE) has become a financial stability concern.For further information, see the Federal Reserve’s Financial Stability Report (PDF) published in October 2023. In a previous Economic Synopses essay, we showed that at least 40% of debt backed by CRE is held by banks. Additionally, in a later essay, we performed a simple stress test, in which we considered different scenarios for changes in the valuation of U.S. banks’ CRE exposures and found that most banks appeared to be sufficiently capitalized to withstand significant drops in CRE valuations.
In this blog post, we study how differences in exposures to CRE have affected the stock market value of different bank holding companies (BHC) after the start of the pandemic. Given the negative outlook on certain segments of CRE, one would expect that more-exposed banks have experienced worse market performances. We found that while CRE exposure has not mattered much for bank stock returns since the 2007-09 financial crisis, the correlation became significantly negative in 2023.
Which Banks Are Most Exposed to CRE?
We begin our analysis by documenting some patterns regarding what types of banks have larger exposures to CRE. The figure below presents a scatter plot in which each dot represents a BHC.We examined publicly traded BHCs that are required to file a consolidated financial statement with the Federal Reserve (FR Y-9C report). The x-axis corresponds to a measure of size (the natural logarithm of total assets) as of the first quarter of 2023, while the y-axis corresponds to our measure of CRE exposure as a percentage of a BHC’s assets in the same period. We computed this measure of exposure by summing the value of CRE loans held by that BHC and the value of other assets, such as mortgage-backed securities, that are also primarily collateralized by CRE. The figure shows a negative correlation between the two variables: Larger banks tend to have smaller CRE exposures as a share of their total assets. In relative terms, the most-exposed banks tend to be medium-sized and small BHCs.
The Relationship between Bank Holding Company Size and Commercial Real Estate Exposure: First Quarter of 2023
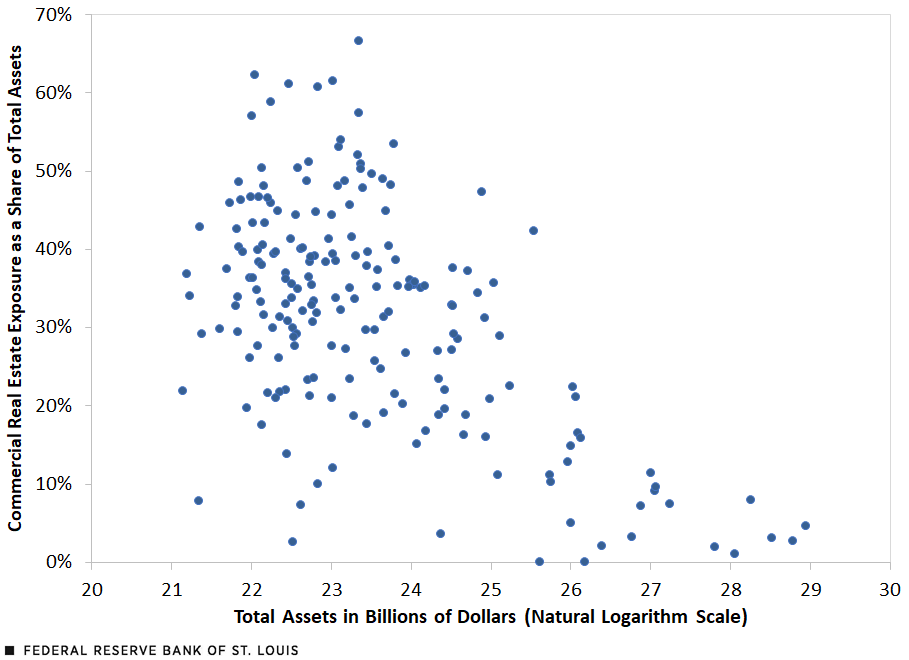
SOURCES: Federal Reserve (FR Y-9C data) and authors’ calculations.
We also computed correlations between CRE exposure and other bank characteristics. The figure below shows the values for some of these correlations. Besides the negative correlation with size that we documented in the first figure, we found that banks with larger CRE exposures tend to have relatively fewer liquid assets on their balance sheets, lower capital ratios (that is, more leverage), a larger share of their liabilities in the form of deposits, and a larger share of their assets in the form of loans. These are common characteristics of smaller banks that traditionally devote a larger share of their business to “core bank business activities”: taking deposits from the public and originating loans. Larger banks tend to rely relatively more on nondeposit funding (such as issuing bonds or obtaining loans from other banks) and hold more non-loan assets (such as securities).
Correlations between Commercial Real Estate Exposure and Other Bank Characteristics
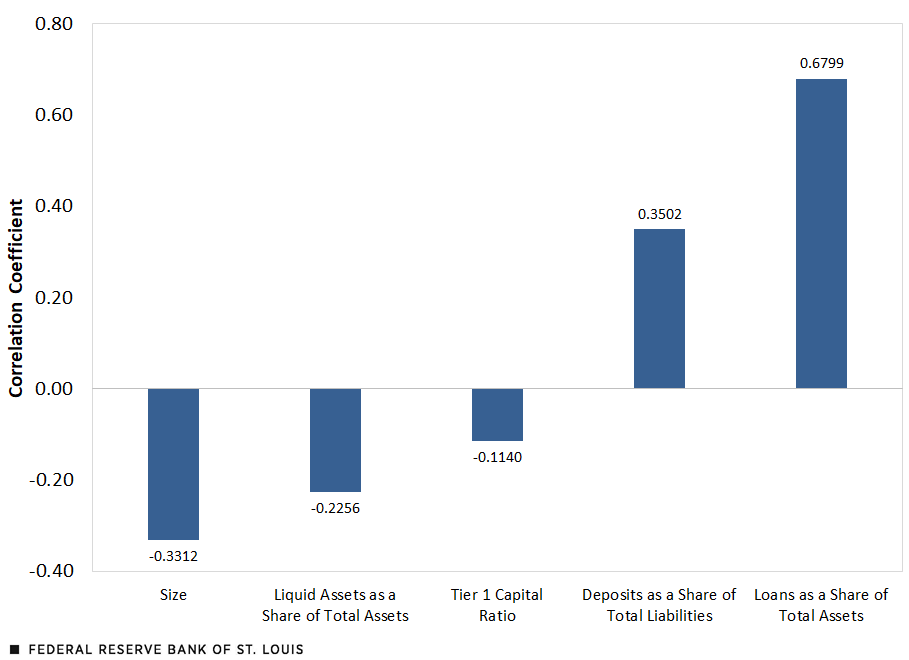
SOURCES: Federal Reserve (FR Y-9C data) and authors’ calculations.
Bank Stock Performance and CRE Exposure
Given the negative outlook on multiple segments of CRE, such as office buildings and suburban shopping malls, it is plausible to assume that the market returns of banks with larger CRE exposures may have been lower than the returns of banks that are better insulated from this source of risk. To analyze this, we measured the correlation between BHC stock market returns and the CRE exposure of each bank.
There are two main issues to consider when interpreting these correlations. The first one is that, as we have previously shown, there are other factors—such as size or leverage—that correlate with CRE exposure, and those could be driving returns. For this reason, we used regression analysis instead of simple correlations, as this allowed us to isolate the effects of CRE exposure on bank returns by controlling for other factors. The second issue is that the nature of this correlation could be changing over time: Given that the outlook on CRE was not necessarily bad before the pandemic, it is reasonable to believe that CRE exposures would not have been a significant driver of returns. Accordingly, we computed separate regressions for each year to capture the fact that the relationship between bank returns and CRE exposures could change over time, depending on macroeconomic and social factors (such as work from home or online shopping).
The next figure plots the evolution of the regression coefficients of BHC stock returns in a given year on CRE exposures in the previous year. This is a measure of correlation that takes into account other factors. Specifically, our additional controls include one-year lags on size, liquid assets as a share of total assets, Tier 1 capital ratio, deposits as a share of total liabilities, loans as a share of total assets, and bank stock returns. We ran the regression on each year from 2001 to 2023. This figure also plots 95% confidence bands.
Regression Coefficient of Bank Holding Company Stock Returns on Commercial Real Estate Exposure
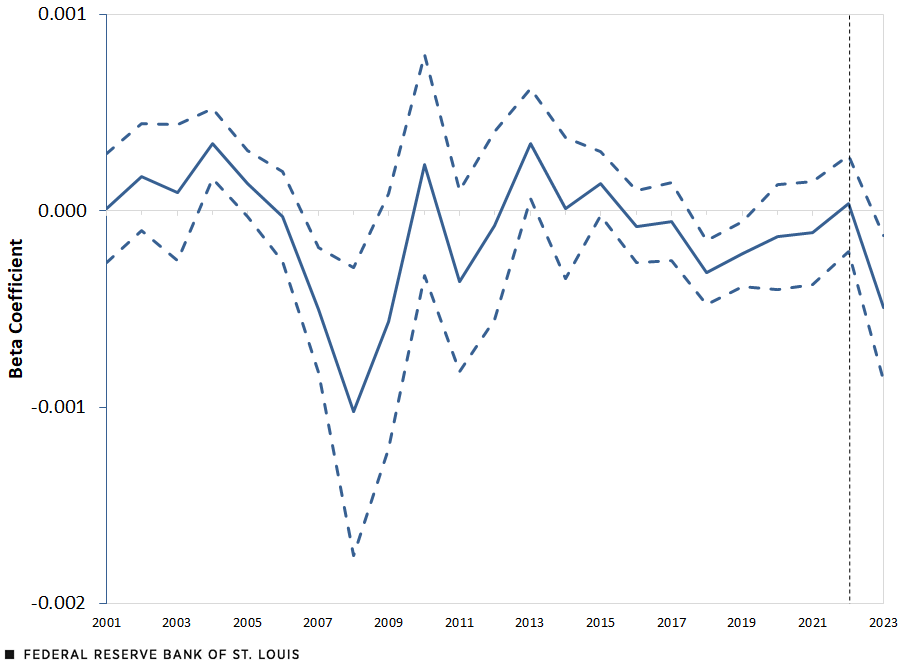
SOURCES: Federal Reserve (FR Y-9C data), Federal Reserve of New York (CRSP-FRB Link), Center for Research in Security Prices and authors’ calculations.
NOTES: The solid blue line is the beta coefficient from the regression of stock market performance on CRE exposure. The dashed blue lines are the 95% confidence interval on the beta estimate. The dashed, vertical black line indicates 2022, the year that the Federal Reserve began to raise its targeted short-term interest rate.
From 2007 to 2008, the beta coefficient was statistically significant and negative, implying that banks with higher CRE exposure had lower stock market returns, all other variables equal. Since the 2007-09 financial crisis affected not only residential real estate but also CRE, it is natural that more-exposed banks performed worse during that time. Our analysis reveals that while the correlation had been mostly inactive since then, it again became significantly negative in 2023.
Taken together, our results suggest that CRE exposures may have been a relevant driver of bank holding company stock returns in 2023, even if they did not seem to matter much during the period following the 2007-09 financial crisis.
Notes
- For further information, see the Federal Reserve’s Financial Stability Report (PDF) published in October 2023.
- We examined publicly traded BHCs that are required to file a consolidated financial statement with the Federal Reserve (FR Y-9C report).


Citation
Miguel Faria-e-Castro and Samuel Jordan-Wood, ldquoCommercial Real Estate Exposure and Bank Stock Returns,rdquo St. Louis Fed On the Economy, April 9, 2024.
This blog offers commentary, analysis and data from our economists and experts. Views expressed are not necessarily those of the St. Louis Fed or Federal Reserve System.
Email Us
All other blog-related questions