


AI and Productivity Growth: Evidence from Historical Developments in Other Technologies
Productivity growth is an important measure of economic well-being. With higher productivity, an economy produces more output for the same amount of input—for example, hours worked. This results in higher standards of living through a wide range of positive outcomes for the economy, such as higher compensation and higher tax revenue.
In recent years, U.S. productivity growth has been significantly lower than average growth from 1930 to 2000. (See the figure below.) Recent developments in artificial intelligence (AI) with large language models (such as ChatGPT, Claude and Llama) present a ray of optimism for future productivity growth.
Aggregate Productivity Growth: 1930-2000 and 2000-2019
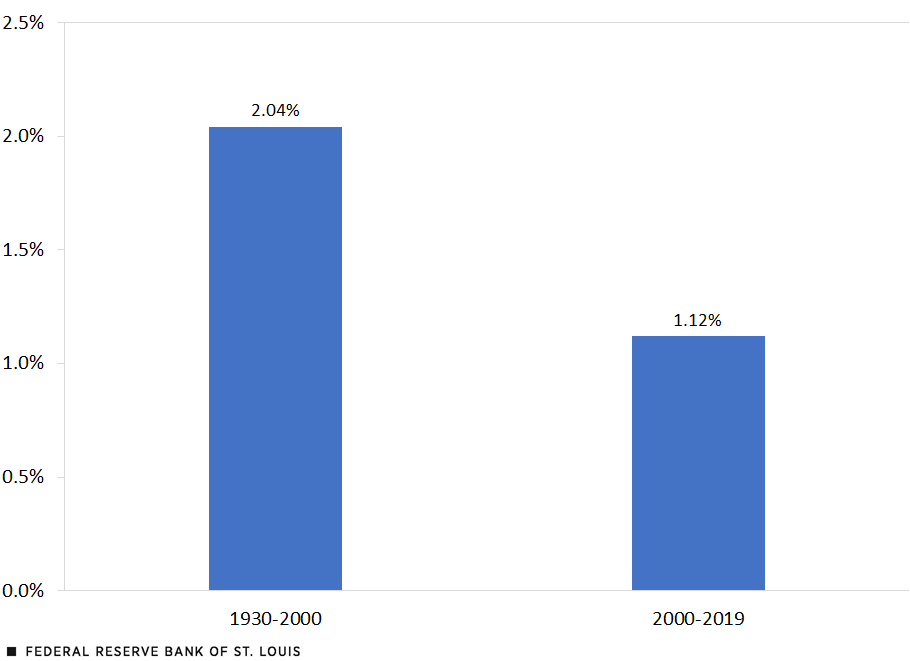
SOURCES: Bureau of Labor Statistics and authors’ calculations.
There are three primary considerations for evaluating productivity growth for any given set of technologies:
- Improvements in productivity for individuals because of AI
- The extent to which AI is adopted by individuals across different firms, industries and cities
- The speed of AI’s diffusion
Several recent studies have tried to estimate the improvement in the productivity level for workers using large language models in online experiments. These studies, which typically measured productivity in terms of the speed and quality at which an assigned task was completed, have found varying results about the increase in productivity, with estimates ranging from 8% to 36%.For examples of this research, see Erik Brynjolfsson, Danielle Li and Lindsey R. Raymond’s 2023 working paper; Shakked Noy and Whitney Zhang’s 2023 article; Sida Peng, Eirini Kalliamvakou, Peter Cihon and Mert Demirer’s 2023 article; and Emma Wiles, Zanele T. Munyikwa and John J. Horton’s 2023 working paper.
In this blog post, we highlight the diffusion patterns of some recent technologies.
The Case of Computers
One of the truly general-purpose technologies is computers. To look at the diffusion of personal computers over time, the figure below plots the percentage of American households who reported using computers for personal use compared with the percentage of workers who reported using such computers for work in the Census Bureau’s Current Population Survey (CPS) Computer and Internet Use Supplement from 1984 to 2015 and 2003, respectively. (After 2003, the CPS does not provide the share of American workers who use a computer at work.)
Diffusion of Personal Computers at Home and at Work
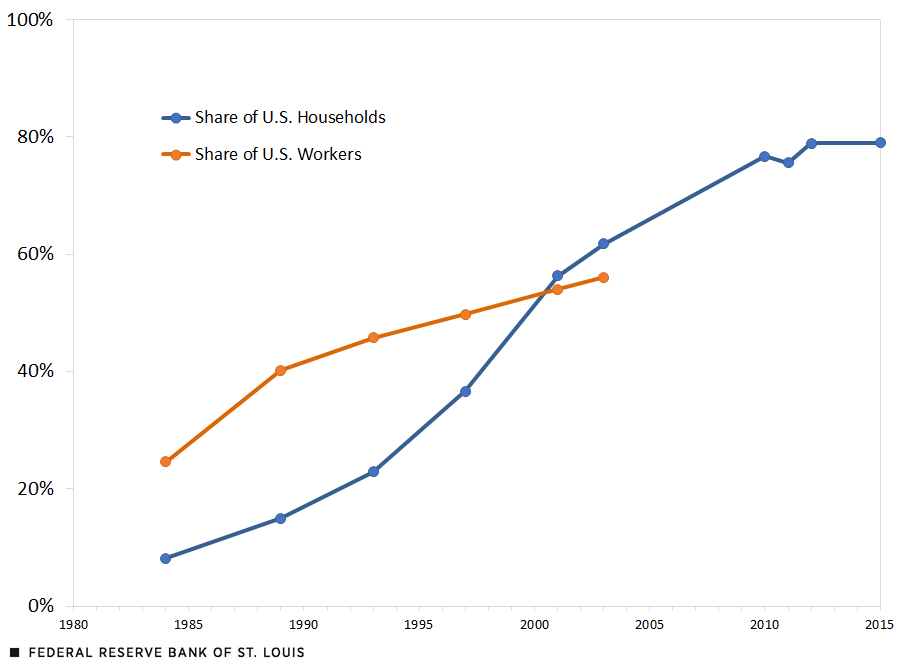
SOURCES: Current Population Survey’s Computer and Internet Use Supplement and authors’ calculations.
These days, computers are a constant presence at work and at home, but they didn’t become widespread overnight. Although the (arguably) first desktop computer available for mass market was produced in 1968 by Hewlett Packard, it wasn’t until more than two decades later that computer usage spread to a significant share of American households, reaching 23% in 1993, according to CPS estimates. The share of workers using computers in their jobs, a more limited measure of computers’ diffusion, also grew relatively slowly before becoming ubiquitous in the 2000s.
By 2012, approximately 79% of U.S. households reported using a desktop, laptop or tablet computer at home, according to CPS estimates. Since then, growth in at-home computer use has primarily come from the diffusion of smartphones and other portable devices. Over 95% of U.S. households reported owning at least one computing device (including smart phones) in 2022.
This widespread adoption of computers was followed by an increase in U.S. productivity growth. Between 1991 and 2004, total factor productivity (TFP) grew 1% per year on average, almost twice as fast as its average growth rate in the 1980s (about 0.6%).Has the Spread Been Faster for More Recent Technologies?
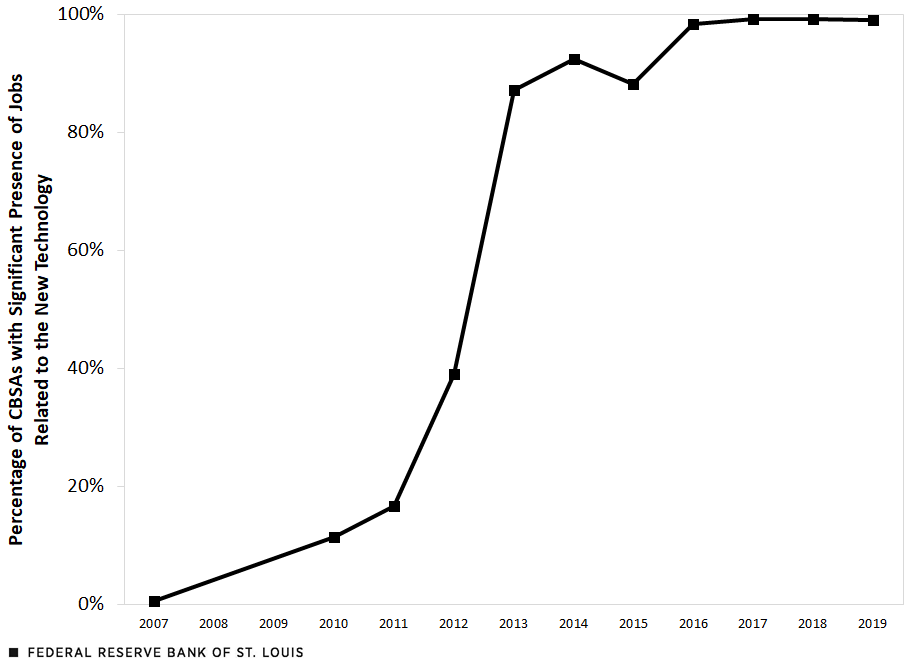
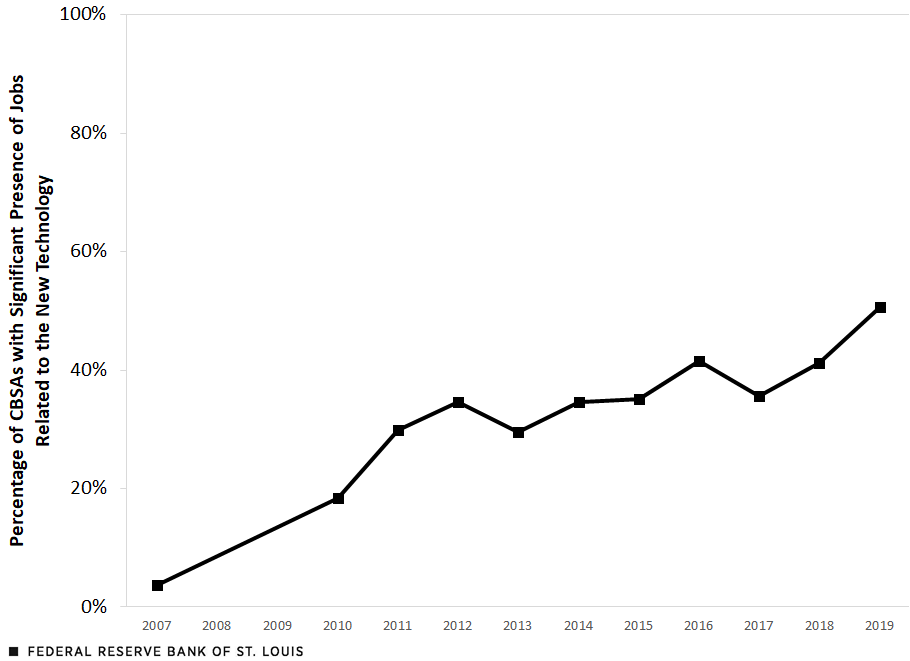
The three figures below track the diffusion of three recent popular technologies—smart devices, cloud computing and 3D printing—in job postings across different urban areas (core-based statistical areas, or CBSAs).For further information on this methodology, see Aakash Kalyani, Nicholas Bloom, Tarek Alexander Hassan, Marcela Mello, Josh Lerner and Ahmed Tahoun’s paper “The Diffusion of New Technologies,” NBER Working Paper No. 28999, National Bureau of Economic Research, 2021 (Revised November 2023). The authors studied the diffusion of new technologies using textual analysis techniques applied to the text of patents, Wikipedia, online job postings and earnings conference calls. These technologies exhibit contrasting patterns of adoption, hinting at the many paths AI could take. The use of smart devices in job postings spread at a rapid rate, reaching almost all urban areas by 2015. On the other hand, the spread of cloud computing and 3D printing has been significantly slower. The first large-scale public cloud computing platform was launched in 2002 with Amazon Web Services, and the first commercial 3D printer was sold in 1988, yet in 2019, job postings included cloud computing and 3D printing in about 50% and 1% of urban areas in the U.S., respectively. Will the future diffusion pattern of AI be more like the pattern of smart devices, cloud computing or 3D printing?
Geographical Diffusion of Smart Devices in Job Openings
Geographical Diffusion of Cloud Computing in Job Openings
Geographical Diffusion of 3D Printing in Job Openings
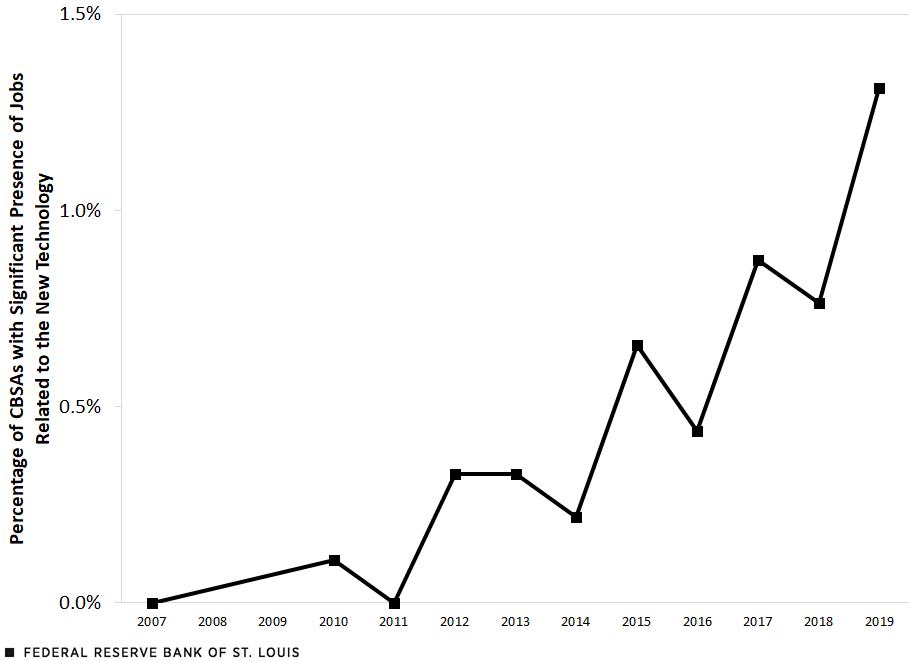
SOURCES FOR THE THREE FIGURES: Data from Kalyani et al. (2021) and authors’ calculations.
NOTE FOR THE THREE FIGURES: A core-based statistical area (CBSA) is considered to have a significant presence of jobs related to the new technology when those particular jobs represent 0.25% of all jobs in that CBSA.
Early Evidence on the Diffusion of AI
Despite popular interest in the productive potential of workplace AI and concerns that it may displace workers, early evidence on the diffusion of AI seems to suggest a pattern similar to those of personal computers and cloud computing. The U.S. Census Bureau regularly surveys firms on their recent business practices, including their use of emerging technologies. Over the past five years, several of these survey waves have asked firms whether they use AI in production. We average the reported use in surveys done in 2023-2024 and compare it against reported use in 2018; the percentage of firms reporting any use of AI in production has increased from around 3% in 2018 to around 4.4% on average across sample waves in 2023-2024.
The lack of widespread usage may continue for a while: When asked whether they expect to use AI six months from now, less than 7% of the same firms said yes. If history is any guide, AI productivity gains might take a long time to realize.
Notes
- For examples of this research, see Erik Brynjolfsson, Danielle Li and Lindsey R. Raymond’s 2023 working paper; Shakked Noy and Whitney Zhang’s 2023 article; Sida Peng, Eirini Kalliamvakou, Peter Cihon and Mert Demirer’s 2023 article; and Emma Wiles, Zanele T. Munyikwa and John J. Horton’s 2023 working paper.
- For further information on this methodology, see Aakash Kalyani, Nicholas Bloom, Tarek Alexander Hassan, Marcela Mello, Josh Lerner and Ahmed Tahoun’s paper “The Diffusion of New Technologies,” NBER Working Paper No. 28999, National Bureau of Economic Research, 2021 (Revised November 2023). The authors studied the diffusion of new technologies using textual analysis techniques applied to the text of patents, Wikipedia, online job postings and earnings conference calls.


Citation
Aakash Kalyani and Marie Hogan, ldquoAI and Productivity Growth: Evidence from Historical Developments in Other Technologies,rdquo St. Louis Fed On the Economy, April 4, 2024.
This blog offers commentary, analysis and data from our economists and experts. Views expressed are not necessarily those of the St. Louis Fed or Federal Reserve System.
Email Us
All other blog-related questions