


Are Developing Countries Facing a Possible Debt Crisis?
Mark Twain is reputed to have said, “History doesn’t repeat itself, but it often rhymes.”There is little evidence that Mark Twain ever made this remark. Over the past year, observers of monetary policy have been wondering whether the current tightening cycle rhymes with Paul Volcker’s monetary policy tightening of the early 1980s.Paul Volcker was chair of the Federal Reserve from 1979 to 1987.
There are certainly some striking similarities. Both episodes were preceded by supply shocks and sharp increases in the prices of many commodities, such as oil. Both times, this led to a rise in U.S. inflation and a corresponding sharp tightening of monetary policy. But whereas in the 1980s this was followed by a sharp recession and a financial crisis in the savings and loan industry, no recession has emerged this time around, and the financial system has remained sound and resilient, notwithstanding a small number of highly publicized bank failures.
In this blog post, we examine whether another aspect of the 1980s—a debt crisis that affected many developing country borrowers—will be repeated in the 2020s. We review a few indicators that economists and policymakers often look at when assessing the likelihood of debt repayment difficulties, or debt distress, and show that they are currently at elevated levels. We conclude with some brief remarks on differences between the 1980s and today that should insulate the U.S. economy from the fallout if a debt crisis were to occur among developing countries.
Bond Spreads as a Measure of Distress
When a country faces debt repayment difficulties, it will sometimes fail to make scheduled principal and interest payments on its debts. This is a default on its debt obligations, and creditors typically have little in the way of legal recourse. Other times, a country will approach its creditors and ask them to accept a reduction or rescheduling of contracted payments. In either case, creditors lose some of the value of their investments.
As a result, debt repayment difficulties lead investors to reduce the prices they are willing to pay to purchase a country’s debts or, equivalently, to increase the interest rate required to compensate them for the greater risk of loss. Currently, interest rates are rising globally as monetary policy tightens, and so, to extract a measure of investor assessments of debt payment difficulties, we must look at the difference or spread between interest rates on the debts of a risky country, such as Lebanon or Argentina, and those paid by a country that is not expected to default, such as the U.S. or Germany.
J.P. Morgan constructs measures of these spreads against comparable U.S. government-issued notes and bonds for a set of emerging market economies that issue significant amounts of debt.For a country to be included in the J.P. Morgan EMBI Global Index, the country’s gross national income (GNI) per capita must be below the index income ceiling for three consecutive years, which is defined as the GNI per capita level that is adjusted every year by the growth rate of the world GNI per capita. For a country’s instruments to be included, they must have at least US$500 million outstanding, at least 2.5 years until maturity initially, and at least one year until maturity left; these can include loans, Brady bonds and Eurobonds. The country must also have daily available pricing from a third-party valuation vender. Over time, there have been 70 countries in this index. We will say that a country is in debt distress if its spreads exceed a conventional, but somewhat arbitrary, threshold of 1,000 basis points (10 percentage points).
The first figure below plots the number of countries in debt distress from the start of 2010 to July 2023. It shows that the number of emerging markets in debt distress spiked significantly to 15 at the beginning of the COVID‑19 pandemic, before reaching their highest levels (22) in the summer of 2022. They remain highly elevated today, with 16 emerging markets considered to be in debt distress. This amounts to 23% of the countries that make up the index.
The Number of Countries in Debt Distress Rose Sharply during the COVID-19 Pandemic
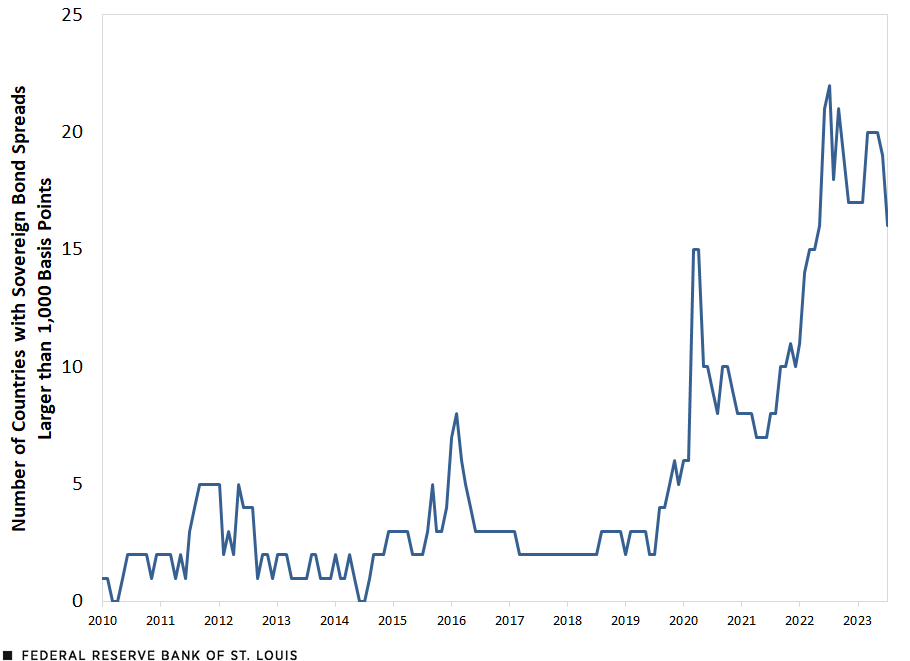
SOURCES: J.P. Morgan, Bloomberg and authors’ calculations.
NOTE: This figure is constructed using the J.P. Morgan Emerging Markets Bond Index (EMBI) Global sovereign spreads. The data are monthly and correspond to the end of the month. We use a threshold of 1,000 basis points to indicate a country is in distress. Since 100 basis points is equivalent to 1 percentage point, this threshold can also be thought of as 10 percentage points.
As a measure of worldwide debt distress, these data have some limitations. First, the sample does not include any of the advanced economies that tend to issue the largest amounts of debt (although such countries, with a few notable exceptions such as those involved in the European debt crisis, tend to be of much lower risk of debt repayment difficulties). Second, the sample excludes countries that issue only modest amounts of privately traded debt (hence, making computation of spreads difficult), as well as those that typically borrow only from other governments and international organizations. For these latter countries, we need alternative measures of debt distress.
Credit Ratings as an Indicator of Distress
An alternative potential measure of current and future debt distress comes from country credit ratings produced by the major credit rating agencies S&P Global and Moody’s Investors Service. These ratings, provided as a service to investors, attempt to rate the risk of a future default (S&P) or the prospect of future investor losses (Moody’s).
Because ratings and spreads are intended to forecast default and investor losses, we should expect a close relationship between them. The figure below plots that relationship using ratings by S&P at the end of 2019, just prior to the onset of the COVID‑19 pandemic.
Developing Countries’ Sovereign Bond Spreads and Credit Ratings, December 2019

SOURCES: J.P. Morgan, Bloomberg, S&P Global and authors’ calculations.
NOTES: The spread refers to the J.P. Morgan Emerging Markets Bond Index (EMBI) sovereign spread and reflects the last available data point in December 2019. Therefore, the credit rating reflects the same period. We omit Venezuela because it is an outlier; the country’s debt has a spread of about 15,000 basis points and a rating of selective default, or SD. In regard to countries with no rating (NR), we included only those who have had their ratings withdrawn.
As shown in this figure, there is a clear negative relationship, with lower credit ratings being associated with higher spreads. The relationship is nonlinear, with the relationship getting stronger for credit ratings below the investment grade cutoff (BBB-).The lowest rating that is considered investment grade by Standard & Poor’s is BBB-. For Moody’s, which uses a different scale, investment grade ratings are Baa3 and above. Importantly for our purposes, and in contrast to the spreads discussed previously, credit ratings are available for as many as 148 countries and have been produced since 1949, depending on the credit rating agency.S&P has produced sovereign ratings since 1949 and currently rates 148 countries, while Moody’s began these ratings in 1949 and currently rates 144 countries.
In interpreting changes in the distribution of credit ratings over time, we need to take into account that the number of rated countries has expanded chiefly through the award of ratings to countries with greater risks of investor losses. As shown in the figure below, S&P rated only seven countries in 1975, and all were rated as investment grade with almost all rated AAA. As the number of rated countries has grown, more and more have been rated at the lower rungs of investment grade, as well as increasingly below investment grade. This caveat should be taken into account when examining trends in credit ratings.
The Distribution of S&P Sovereign Ratings
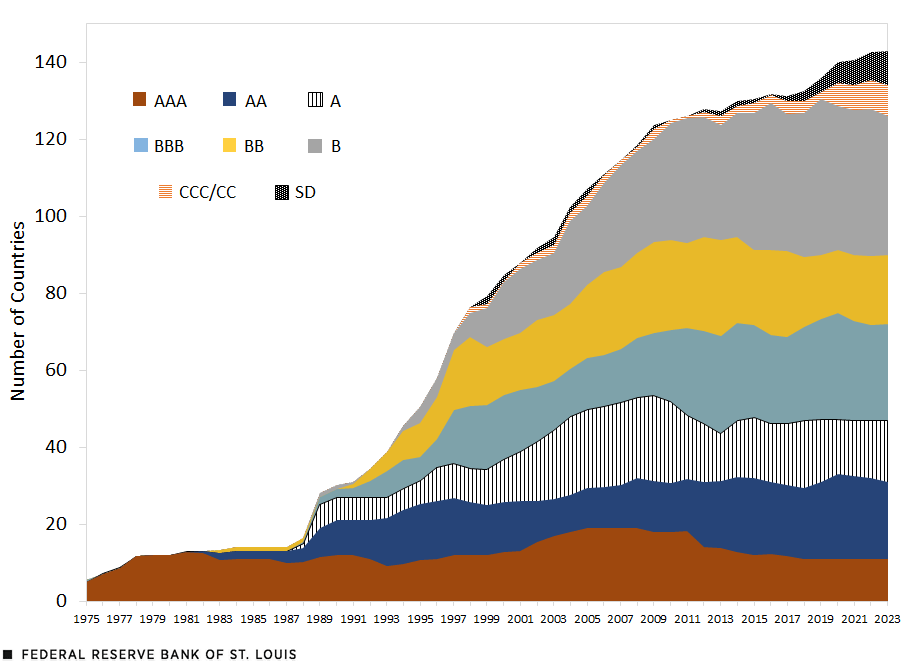
SOURCES: S&P Global and authors’ calculations.
NOTE: The credit rating for a specific country is the average credit rating over the year. We group “plus” and “minus” values with the letter that is associated with the rating.
To better gauge debt distress, we now focus on rates that meet or fall below S&P’s B- and Moody’s B3; both ratings are considered “highly speculative.” The figure below plots the number of countries rated in debt distress by each of the two major ratings agencies.
Rated Countries in Distress
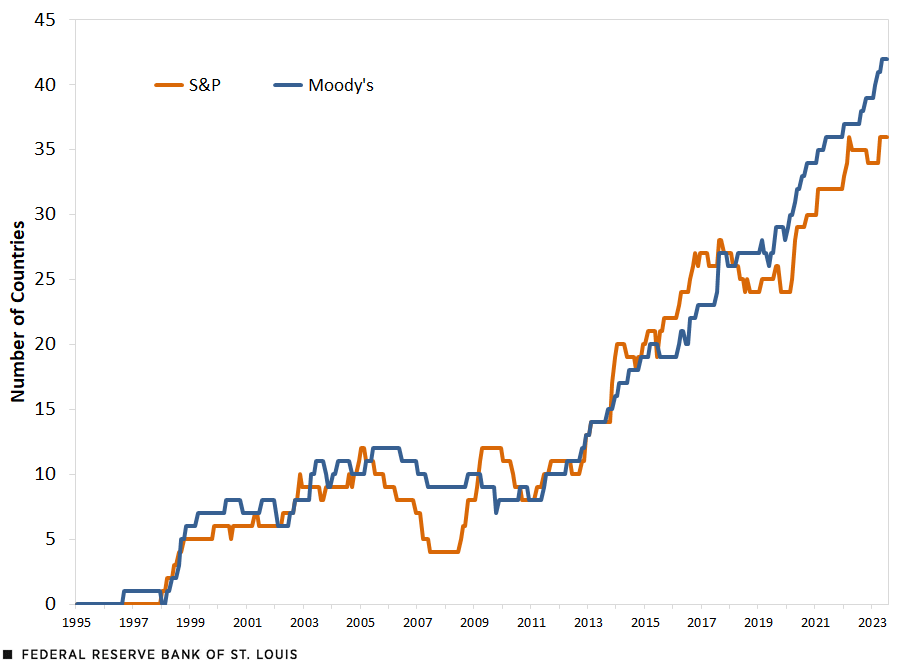
SOURCES: Moody’s Investors Service, S&P Global and authors’ calculations.
NOTES: Debt distress is defined as a rating of B- or lower for S&P Global ratings, and B3 or lower for Moody’s ratings. Though the earliest sovereign rating appeared in 1949, we do not show data going back that far because the first credit rating that indicated debt distress appeared in 1996.
Using this definition results in 36 and 42 countries being classified as in debt distress today using S&P and Moody’s credit ratings, respectively, which is a significant increase from the levels at the end of 2019 prior to the pandemic. This means an additional 20 (S&P) and 26 (Moody’s) countries are identified as being in debt distress beyond the 16 identified from bond spread data.
Our credit ratings example paints a much wider picture of debt distress than the emerging market spreads studied earlier. Even so, there are many countries that do not have a credit rating. Often these are countries that are very poor or very small, so there is little chance that they would issue debt that is publicly traded among private investors.
World Bank and International Monetary Fund Debt Distress Ratings
The World Bank and International Monetary Fund (IMF) also produce ratings for International Development Association countries that are eligible under the Low-Income Country Debt Sustainability Framework; that is, countries that are low income and typically cannot tap international debt markets for funding. Rating levels include “in distress” as well as “high,” “moderate” and “low” risk of future debt distress as of the country’s last debt sustainability analysis, with ratings provided both for external debt (debt borrowed from international creditors) and for total debt including domestic debt.
There are currently 67 countries that are rated under this framework, with more than half of them (36) being classified as in distress or at high risk of future debt distress. Of the 67 countries, 33 are rated by the World Bank/IMF and not the credit rating agencies. This allows us to see and understand the capability of a different set of countries to repay their debt. Of the 33 countries rated by the World Bank/IMF and not the credit rating agencies, 23 of them are in distress or at high risk of future debt distress.
If we looked at only those rated by the credit rating agencies, we would miss the fact that more countries are in or close to being in debt distress. Different measures of debt distress allow us to gain more and different information about countries.
Risks Have Increased, but Possible Impact on U.S. Likely to Be Smaller
Does 2023 rhyme with the early 1980s? It certainly does insofar as the prospects a developing country debt crisis have increased. In the past few years, 11 countries have already defaulted, while another 48 (or 54, depending on the credit rating agency you use) are in or at high risk of debt distress, as shown by the combination of bond spreads, private credit rating agency assessments, and the World Bank and IMF designation for low-income countries. By way of comparison, at the height of the 1980s debt crisis, 58 countries were in default in the sense of having outstanding arrears owed to either official creditors or to private-sector banks and bondholders.
Episodes of debt distress are as likely as before to inflict economic hardship on the affected countries. Debt restructuring negotiations may also be more complicated this time because of the presence of new official creditors such as China and the Persian Gulf States, who are not members of the venerable Paris Club of official creditors.The Paris Club is a group of 22 countries serving to provide debt treatments to countries experiencing debt distress. The G20’s new unified framework for debt restructuring has also not been fully tested.The G20, a group of industrialized and developing countries, addresses major issues related to the global economy.
But viewed from the self-centered perspective of the U.S. economy, the consequences of such a debt crisis for the U.S. are likely to be far smaller. In the 1980s, the eight largest U.S. money center banks had exposures to developing countries on the order of 2.5 times the level of their capital, and they had set aside few reserves. Today, direct exposures to developing-country government debt among major banks appear quite limited.This is based on our examination of the annual reports of the top U.S. banks. By being less exposed, if there is a debt crisis, the U.S. should be directly impacted less than in the 1980s.
Notes
- There is little evidence that Mark Twain ever made this remark.
- Paul Volcker was chair of the Federal Reserve from 1979 to 1987.
- For a country to be included in the J.P. Morgan EMBI Global Index, the country’s gross national income (GNI) per capita must be below the index income ceiling for three consecutive years, which is defined as the GNI per capita level that is adjusted every year by the growth rate of the world GNI per capita. For a country’s instruments to be included, they must have at least US$500 million outstanding, at least 2.5 years until maturity initially, and at least one year until maturity left; these can include loans, Brady bonds and Eurobonds. The country must also have daily available pricing from a third-party valuation vender. Over time, there have been 70 countries in this index.
- The lowest rating that is considered investment grade by Standard & Poor’s is BBB-. For Moody’s, which uses a different scale, investment grade ratings are Baa3 and above.
- S&P has produced sovereign ratings since 1949 and currently rates 148 countries, while Moody’s began these ratings in 1949 and currently rates 144 countries.
- The Paris Club is a group of 22 countries serving to provide debt treatments to countries experiencing debt distress.
- The G20, a group of industrialized and developing countries, addresses major issues related to the global economy.
- This is based on our examination of the annual reports of the top U.S. banks.


Citation
Mark L.J. Wright and Amy Smaldone, ldquoAre Developing Countries Facing a Possible Debt Crisis?,rdquo St. Louis Fed On the Economy, Sept. 5, 2023.
This blog offers commentary, analysis and data from our economists and experts. Views expressed are not necessarily those of the St. Louis Fed or Federal Reserve System.
Email Us
All other blog-related questions