


Economic Development and the Evolution of Mortality
Standard of living, as typically measured by gross domestic product (GDP) per capita, has generally been increasing over time. However, GDP per capita has not been growing uniformly across countries. In fact, the GDP per capita gap between rich and poor countries has not been shrinking.Poor countries are in the first quintile of the cross-country distribution of real GDP per capita in 1960, and rich countries are in the fifth quintile.
For rich countries, we see that their GDP per capita has more than tripled over the last 60 years, from about $15,300 in 1960 to about $50,000 in 2019. Poor countries also have increased their GDP per capita, from about $300 to $5,200 during that same period. Despite this increase, the GDP per capita of poor countries in 2019 was only about a third of the GDP per capita of rich countries in 1960—not even reaching the 1960 GDP per capita level of rich countries. (See the figure below.)
Real GDP Per Capita
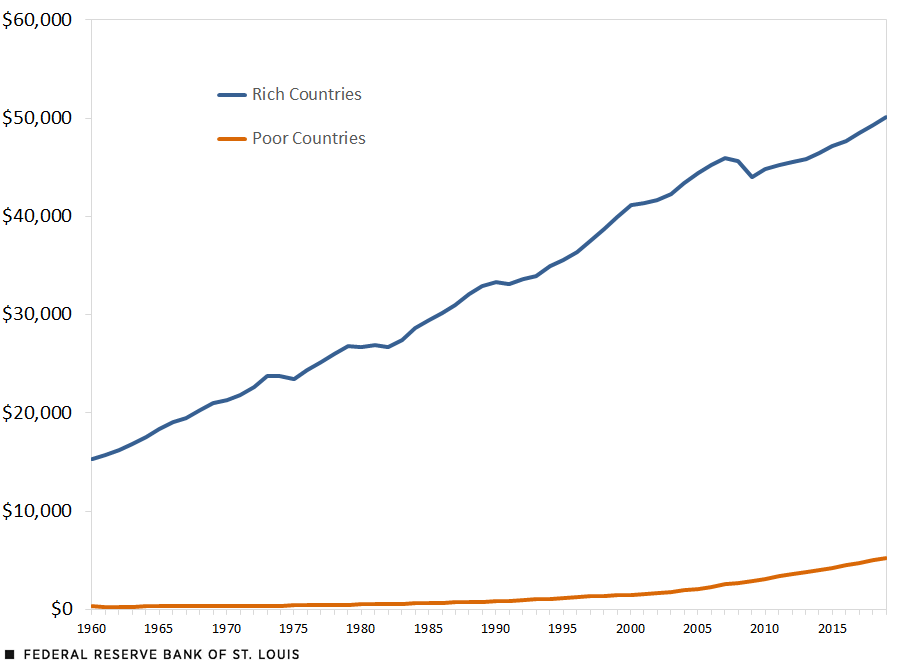
SOURCES: World Bank and authors’ calculations.
NOTES: Values are in 2015 dollars. Poor countries are in the first quintile of the cross-country distribution of real GDP per capita in 1960, and rich countries are in the fifth quintile. We keep these groups of countries constant over time. For each group, the yearly average GDP per capita is weighted by country population.
The Evolution of the Crude Death Rate since 1960
Other indicators of economic development, such as the crude death rate (CDR), however, do not tell the same story. Crude death rate is a measure of mortality, or health more generally. It measures how many deaths per person in a population occur each year. CDR reflects the health and living conditions in a country.
Using the same grouping of countries as in the figure above, we plotted the CDR of poor and rich countries over time (measured as a percentage of population) in the figure below.
Crude Death Rate
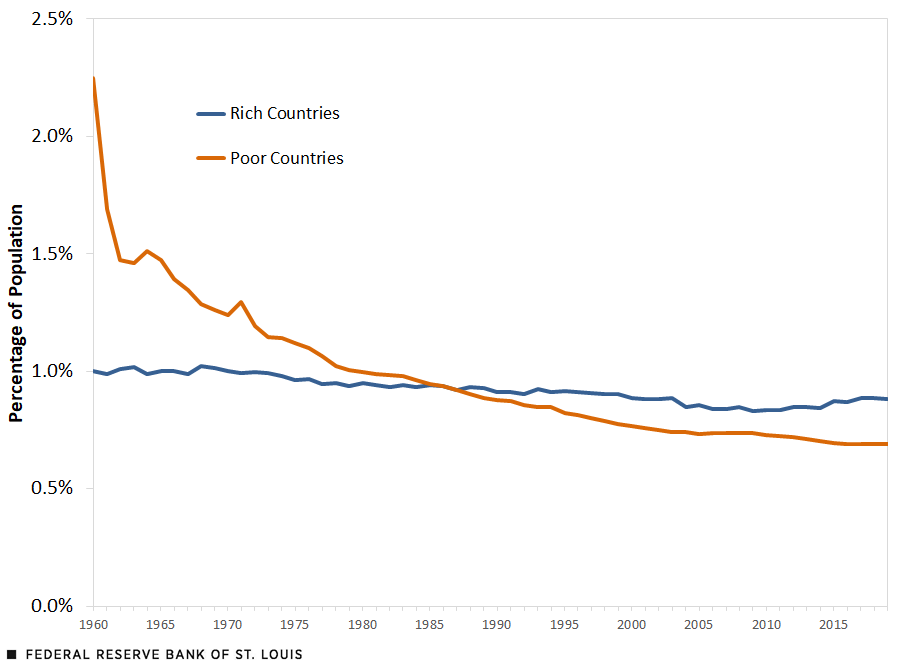
SOURCES: World Bank and authors’ calculations.
NOTES: Poor countries are in the first quintile of the cross-country distribution of real GDP per capita in 1960, and rich countries are in the fifth quintile. We keep these groups of countries constant over time. For each group, the yearly average crude death rate is weighted by country population.
We see that in 1960 the CDR in poor countries was a little more than double that in rich countries. This means that given a country with the same population size in each income group, the number of deaths in the poor country were about double that in the rich country.
Over the next six decades, the CDR declines in both rich and poor countries. By 2019, the gap in CDR has practically vanished. This means that health outcomes, broadly defined, have converged, despite GDP per capita not converging.
The Case of Madagascar
To highlight this even further, consider Madagascar. From 1960 to 2019, Madagascar’s GDP per capita (in 2015 dollars) declined from about $820 to $480. This makes the annual average growth rate of GDP per capita about -1%. Despite the income of the country falling, the CDR decreased from around 2.15% of the population in 1960 to about 0.65% in 2019. This shows that health and life outcomes can improve within a country without the country’s standard of living improving.
CDR does not display the lack of convergence that is seen in GDP per capita. This means that the factors that drive improved health indicators are not necessarily reflected in GDP per capita.
Note
- Poor countries are in the first quintile of the cross-country distribution of real GDP per capita in 1960, and rich countries are in the fifth quintile.


Citation
B. Ravikumar and Amy Smaldone, ldquoEconomic Development and the Evolution of Mortality,rdquo St. Louis Fed On the Economy, Oct. 2, 2023.
This blog offers commentary, analysis and data from our economists and experts. Views expressed are not necessarily those of the St. Louis Fed or Federal Reserve System.
Email Us
All other blog-related questions