


Examining the Rapid Rise of U.S. National Wealth since 2012
In a stable economy, national wealth and gross domestic product (GDP) are generally expected to rise and fall together closely, resulting in a wealth-to-GDP ratio that remains relatively constant. The U.S. wealth-to-GDP ratio, however, rose rapidly over the last decade. What could account for this increase?
St. Louis Fed Research Officer YiLi Chien and Research Associate Ashley Stewart examined this question in an October 2022 Economic Synopses essay documenting recent changes in U.S. national wealth and their implications for the economy.
Chien and Stewart observed that U.S. national wealth rose from $69 trillion to $153 trillion between 2012 and 2021, and that it has continued to increase, even when inflation and economic growth are taken into account. The authors defined national wealth as the total nominal value of tangible assets—such as real estate, durable goods, structures and equipment—controlled by four main sectors in the economy:
- Households and nonprofit organizations
- Noncorporate business
- Corporate business
- Federal, state and local governments
Recent Variations in U.S. Wealth-to-GDP Ratio
The following figure from the Economic Synopses essay looks at the U.S. wealth-to-GDP ratio broken down by those four sectors. It shows that this ratio was relatively consistent from 1950 to 1995, varying only between 350% and 400%. In the mid-1990s, however, the ratio began exhibiting a cyclical pattern, mostly due to changes in the value of assets controlled by corporate businesses and households.
U.S. National Wealth by Sector as a Percentage of Nominal GDP, 1980-2021
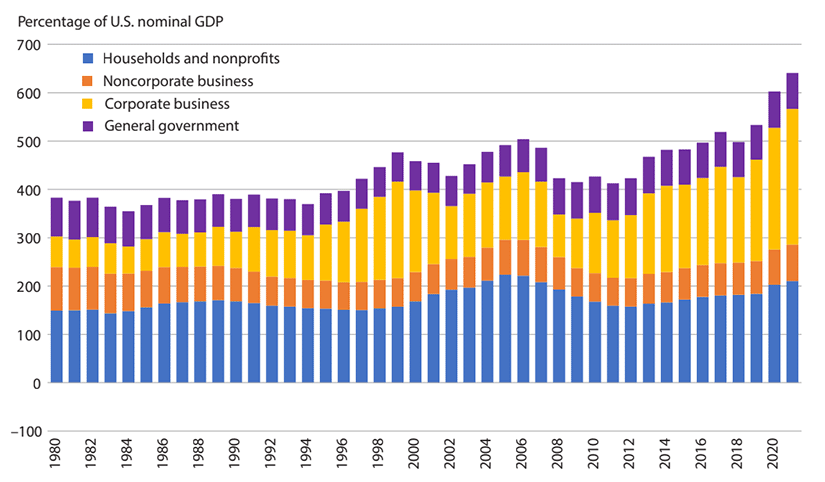
SOURCE: Board of Governors of the Federal Reserve System.
NOTE: For readability, the figure does not show the period prior to 1980.
“The first noticeable cycle started around 1995, peaked in 1999, and then reached its trough in 2002; it was mainly driven by variation in the value of corporate business and is associated with the internet bubble,” Chien and Stewart wrote. “The second cycle, overlapping with the first cycle, was driven by the changes in the value of residential housing and reached its peak in 2006.”
Furthermore, as the authors point out, the increase in the value of corporate business supplemented by the increase in residential housing value have caused the U.S. wealth-to-GDP ratio to surge over the past decade, far surpassing the peaks in 1999 and 2006.
Market Power: An Explanation for the U.S. Wealth-to-GDP Ratio’s Rapid Rise?
The authors considered increases in market power—firm’s influence on prices—as one possible explanation for the rise in the U.S. wealth-to-GDP ratio. Greater market power increases firms’ profits, leading to a higher valuation of the U.S. corporate business sector and, potentially, the expectation that its profitability will rise quickly in the future. This assumption, which is supported by the high price-to-earnings ratios among U.S. tech companies, could mean that wealth originating from the corporate business sector reflects GDP’s future growth rather than its present value. This, they note, could result in a higher U.S. wealth-to-GDP ratio.
According to Chien and Stewart, GDP may not account well for many services that U.S. tech companies offer—social networking services, for example.
“These services are essentially free yet are still considered valuable by consumers,” they write. “For this reason, current GDP might be underestimated, which could further explain the high wealth-to-GDP ratio in the past decade.”
Citation
ldquoExamining the Rapid Rise of U.S. National Wealth since 2012,rdquo St. Louis Fed On the Economy, March 28, 2023.
This blog offers commentary, analysis and data from our economists and experts. Views expressed are not necessarily those of the St. Louis Fed or Federal Reserve System.
Email Us
All other blog-related questions