How Do Firms Differ in Rich and Poor Countries?
Output per capita differs dramatically across countries. In 2015, according to data from the World Bank, Belgium had a gross domestic product (GDP) per capita of $49,492, placing it at the 90th percentile of the global distribution. Uganda, at the 10th percentile, had a GDP per capita of $2,052: less than a twentieth that of Belgium. These differences translate into vastly different living standards, depending on where one lives.
Why do Belgians produce so much more than the residents of Uganda? Part of the answer is that the firms in these countries operate very differently. Researchers can measure these differences using firm-level data from the World Bank Enterprise Surveys (WBES). The World Bank conducts these surveys in many countries, allowing them to construct representative samples of firms across a wide range of economies.
To improve comparability across samples, I focused on manufacturing firms with five or more employees. (The WBES are intended to survey registered formal firms with five or more employees; they occasionally survey firms with fewer employees, but I dropped those observations.) For each country, I used the latest available survey year.
Stark Differences in Size, Organization and Workforces
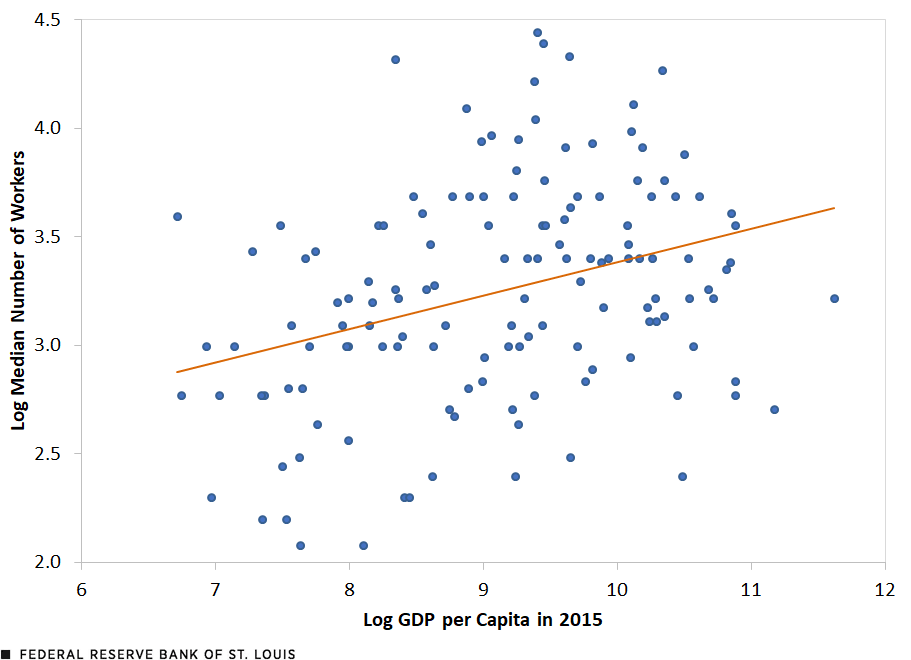
To start, firms in poor countries tend to be much smaller than those in wealthy countries. The first scatter plot compares the median firm size with GDP per capita, with both plotted on a logarithmic scale. Firms in richer countries tend to be substantially larger. In fact, this figure understates the true differences in firm size, since the WBES only survey firms with five or more employees. Using data on the full distribution of firm sizes in many countries, Pedro Bento and Diego Restuccia found an elasticity of around 0.3, as reported in a 2021 article. In other words, a country that is 10% richer will, on average, have 3% more workers per firm.
Firm Size Compared with GDP per Capita

SOURCES: World Bank Enterprise Surveys, World Development Indicators and author’s calculations.
NOTES: Gross domestic product (GDP) is adjusted to constant 2017 dollars based on purchasing power parity (PPP). Firm data are derived from manufacturing firms with five or more employees.
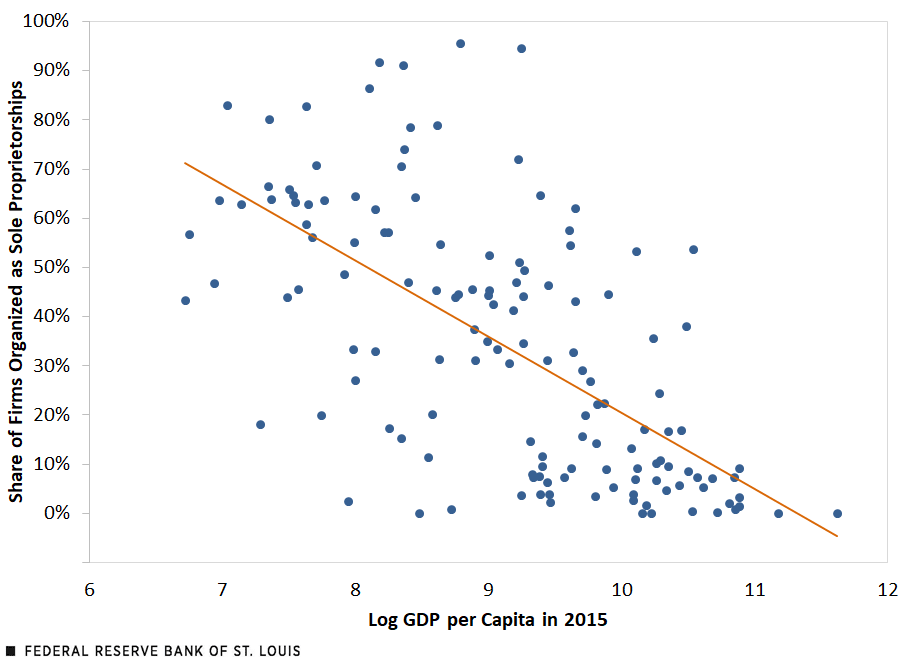
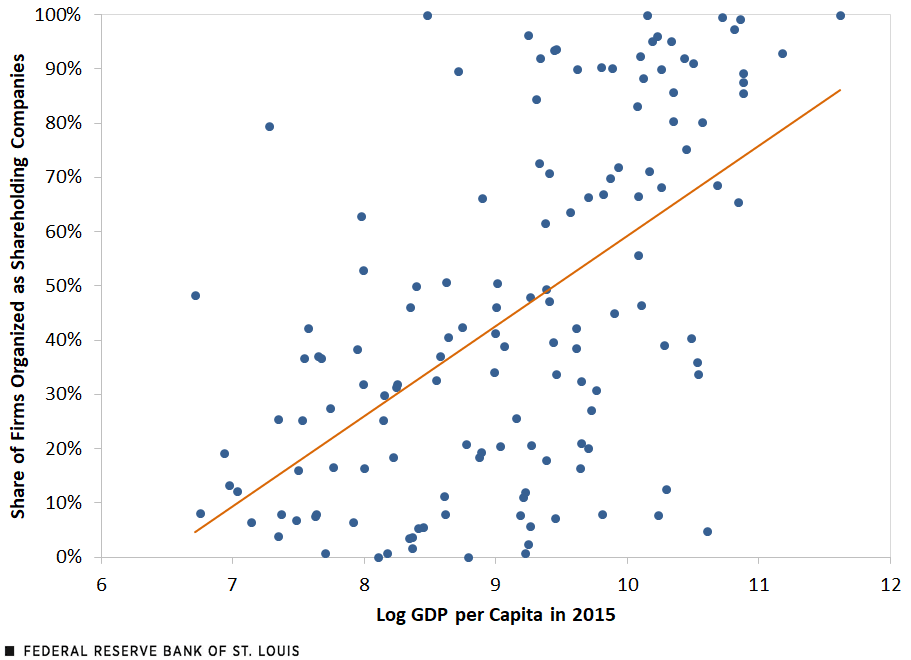
Firms in poor countries also tend to be organized differently than firms in rich countries. Firms in poor countries are often sole proprietorships or family firms. The two scatter plots below show how the organizational structure of firms varies with GDP per capita. The share of sole proprietorships declines with increased GDP per capita, while the percentage of firms that are organized as shareholding companies rises substantially with increased GDP per capita.
Share of Sole Proprietorships Compared with GDP per Capita

SOURCES: World Bank Enterprise Surveys, World Development Indicators and author’s calculations.
NOTES: Gross domestic product (GDP) is adjusted to constant 2017 dollars based on purchasing power parity (PPP). Firm data are derived from manufacturing firms with five or more employees.
Share of Shareholding Companies Compared with GDP per Capita

SOURCES: World Bank Enterprise Surveys, World Development Indicators and author’s calculations.
NOTES: Gross domestic product (GDP) is adjusted to constant 2017 dollars based on purchasing power parity (PPP). Firm data are derived from manufacturing firms with five or more employees.
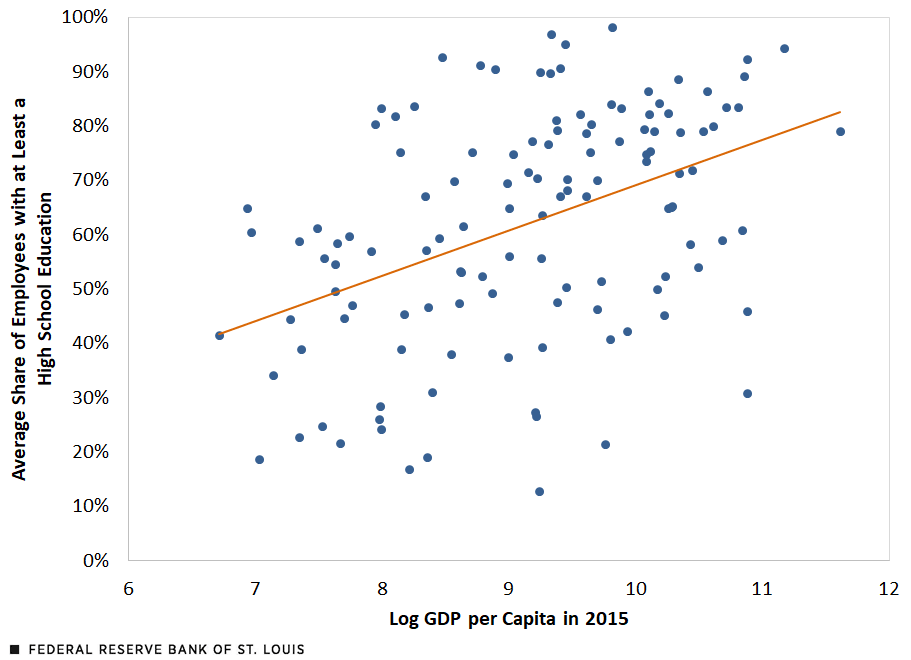
In addition, firms in rich countries tend to employ a more educated workforce. In the scatter plot below, we show the average share of workers with a high school education or higher, and how this share varies with GDP per capita plotted on a logarithmic scale. The differences are stark: For example, at Belgian manufacturing firms, an average of 83% of workers have at least a high school education, compared with only 55% of workers at Ugandan firms.
Employees’ Education Compared with GDP per Capita

SOURCES: World Bank Enterprise Surveys, World Development Indicators and author’s calculations.
NOTES: Gross domestic product (GDP) is adjusted to constant 2017 dollars based on purchasing power parity (PPP). Firm data are derived from manufacturing firms with five or more employees.
Finally, firms in poor countries also tend to be informal: They are not registered with the government, often for the purpose of evading taxes or regulation. In a 2014 article, Rafael La Porta and Andrei Shleifer used a variety of measures to document that informality is much more prevalent in less developed economies. They found that in the bottom quartile of the global income distribution, 35% of GDP comes from informal firms, while only 17% of GDP comes from informal firms in the top quartile.
What Are the Root Causes of Firm Differences?
We have seen that firms differ substantially across rich and poor countries. But why they differ, and how this connects to development, is an open question. The prevalence of small informal firms run as sole proprietorships may reflect deeper issues.
In a 2017 article, Bento and Restuccia argued that the small size of firms in poor countries reflects a lack of investment in technology improvements, because firms expect to face distortions that will reduce the profitability of such investments.
Ufuk Akcigit, Harun Alp and Michael Peters argued in a 2021 article that small firm size and low output per capita are both driven, in part, by developing country firms’ inability to delegate to managers who are not family members.
Further understanding firm differences, as well as the causal links between firm differences and economic development, will help us understand how people living in less developed economies can enjoy a better standard of living.
Citation
Jeremy Majerovitz, ldquoHow Do Firms Differ in Rich and Poor Countries?,rdquo St. Louis Fed On the Economy, March 2, 2023.
This blog offers commentary, analysis and data from our economists and experts. Views expressed are not necessarily those of the St. Louis Fed or Federal Reserve System.
Email Us
All other blog-related questions


