Infrastructure and the Future Growth of the Global Natural Gas Market
Natural gas is a critical fuel and input in modern economies. How has the global trade for natural gas grown in recent years, and what constraints might it face?
In a December Economic Synopses essay, St. Louis Fed Senior Economist Fernando Leibovici and Research Associate Jason Dunn explored recent developments in the tradability of natural gas, focusing on the growth of liquefied natural gas (LNG), and investigated potential bottlenecks that may constrain the development of this growing market.
“The LNG market has vastly increased the tradability of natural gas, allowing countries with natural gas sources to benefit through higher sales of gas to countries without such sources,” they wrote.
Liquefied Natural Gas Market Has Grown Substantially since 2000
The authors noted that in the past three decades, technological developments have made it easier to liquefy natural gas, thus increasing the tradability of this commodity. They pointed out three key steps in the process of shipping natural gas:
- Natural gas is liquefied at the source port.
- LNG tankers carry the product to the destination port.
- Natural gas is “regasified” at a dedicated terminal at the destination port.
“Each step of this process is necessary and costly, often involving large-scale, long-term investments,” they wrote.
Leibovici and Dunn highlighted the substantial growth in LNG trade since 2000, both in the countries involved in trading the product and in the volume of that business.
- The number of countries exporting LNG increased from 12 in 2000 to around 20 in 2021, while the number importing the product rose from 11 to 43 during that time.
- The volume of global LNG trade rose from 102.6 million metric tons in 2000 to 380.2 million metric tons in 2021. During this same period, the LNG share of the global trade in natural gas increased from 26% to 42%.
The Critical Role of LNG Infrastructure Capacity
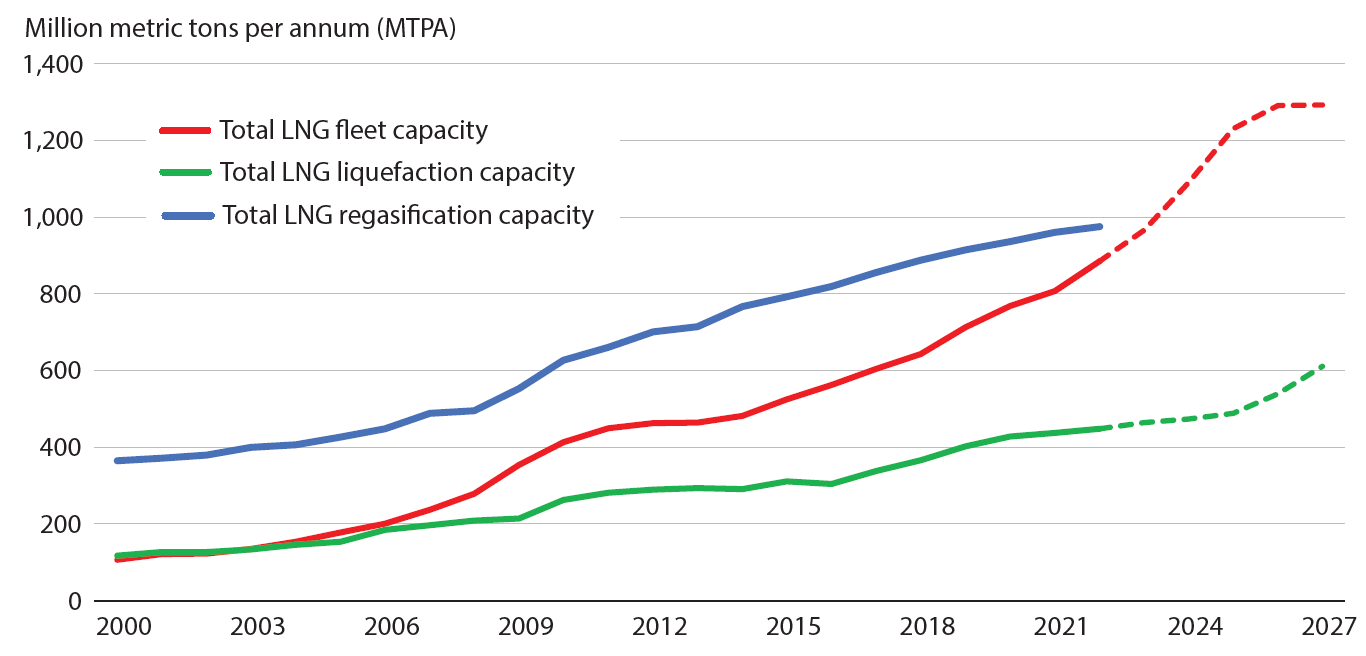
The authors then examined how LNG infrastructure has expanded to support the growth in this trade. The figure below, which is from their essay, plots this capacity in three areas: liquefication capacity, fleet capacity and regasification capacity.
LNG Shipping and Conversion Capacity

SOURCE: Clarksons Shipping Intelligence Network.
NOTE: Dashed lines reflect projections.
As shown in the figure, liquefaction capacity (green line) is the most-binding constraint since it lies below both regasification and fleet capacity, the authors pointed out.
“In fact, liquefaction capacity has been below fleet capacity for the past 18 years or so, with a growing gap that is projected to widen through 2027,” they wrote. “These patterns suggest that liquefaction will likely be an important bottleneck for the future growth of LNG trade.”
Leibovici and Dunn also examined LNG infrastructure investments, focusing on new orders in LNG fleets and the number of LNG liquefaction terminals that are expected to be built. They found increased investments in both of these areas after Russia’s 2022 invasion of Ukraine. (See the related figures in their Economic Synopses essay.)
“Given the Russia-Ukraine war, gas-trading countries throughout the world—particularly in Europe—are looking to LNG as a means of maintaining access to gas for their economies,” the authors wrote. “To further expand this market, the industry must expand its regasification capacity, liquefaction capacity, and fleet size.”
Citation
ldquoInfrastructure and the Future Growth of the Global Natural Gas Market,rdquo St. Louis Fed On the Economy, June 20, 2023.
This blog offers commentary, analysis and data from our economists and experts. Views expressed are not necessarily those of the St. Louis Fed or Federal Reserve System.
Email Us
All other blog-related questions

