


The Impact of the Death Rate on the Graying of America
By 2034, there will be more people age 65 and older than people under 18, according to U.S. Census Bureau projections. What is helping to drive this aging of the U.S. population?
In an April Economic Synopses essay, St. Louis Fed economist and Senior Vice President B. Ravikumar and Senior Research Associate Iris Arbogast focused on how changes in the death rates for different age groups can affect the average age of the U.S. population.
What Affects the Age Distribution of the Population?
The authors noted that the age distribution of the population is affected by three variables:
- Birth rate
- Death rate
- Net migration rate
Of these three factors, Ravikumar and Arbogast focused on the death rate—the number of people per 1,000 who died each year divided by the midyear population. Using data from the United Nations World Population Prospects database, they noted that from 1950 to 2019, the death rate fell for all age groups but at different rates. As an example, they pointed out that the death rate for a 65-year-old dropped from 28.6 in 1950 to 12.8 in 2019 while the rate for a 70-year-old fell from 42.7 to 18.2, respectively. (See figure below.)
Death Rates for Old Age Groups, 1950-2019
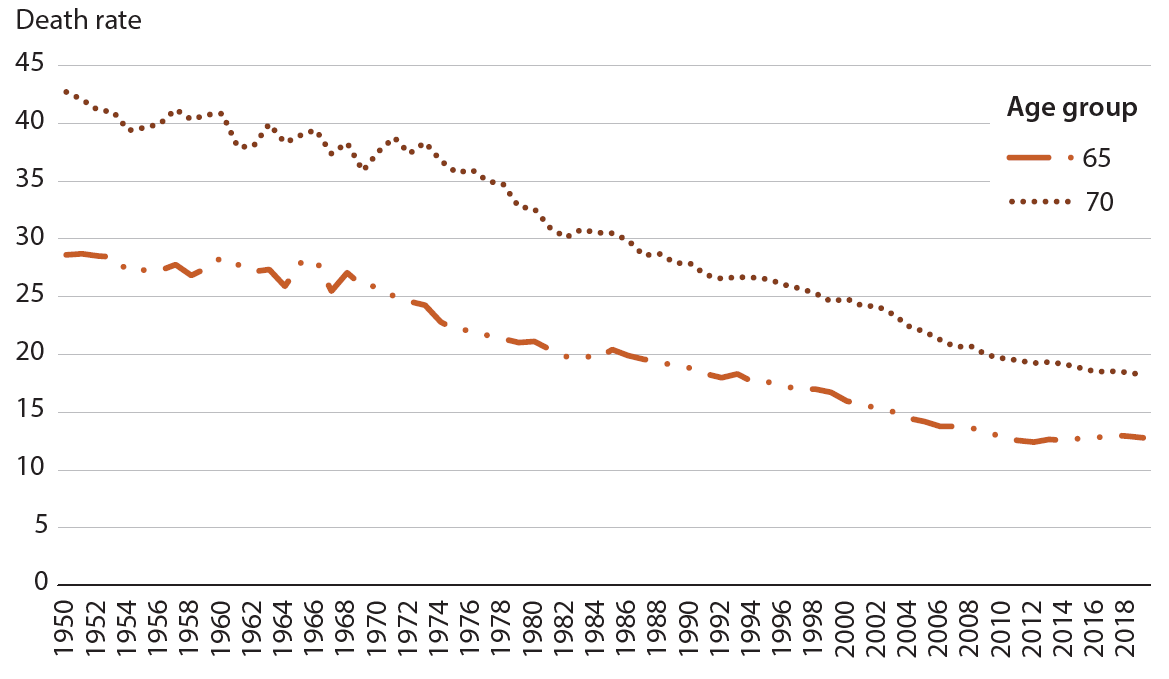
SOURCES: United Nations World Population Prospects 2022 and authors’ calculations.
NOTE: Death rates are the number of people per 1,000 who die each year divided by the midyear population.
Gauging the Effects of Age-Specific Death Rates
So how do changes in age-specific death rates affect the age distribution for the entire country? To answer this question, Ravikumar and Arbogast ran two counterfactuals:
- Hold the death rate fixed at the 1950 level for those ages 60 to 79.
- Hold the death rate fixed at the 1950 level for age 0 (newborns) to 19.
“In these counterfactuals, if holding the death rate fixed for a specific age group does not result in a significant change in the proportion of people 65 years of age and older, then we can conclude that the decline in mortality of the specific age group did not contribute to the increased average age of the US population,” they wrote.
(The counterfactuals excluded net migration. For more on their methodology for calculating the yearly population for each age group for these counterfactuals, see the essay.)
In the first counterfactual, the authors found that the share of people age 65 and older would have declined from 15.9% of the population to 12.7% if the death rate for this age group had been held at the 1950 level.
“Thus, part of the age distribution shift to an older population has been a result of the decrease in death rates for older people,” they wrote.
In the second counterfactual, they found that the share of people age 65 and older would have been nearly unchanged—from 15.9% to 16.2%—if the death rate for ages 0-19 had been held at the 1950 level.
“The magnitude of the change for the counterfactual holding death rates fixed for older people is 10 times more than the magnitude of the change holding death rates fixed for younger people,” the authors concluded.
Interested in more demographic analysis? See Ravikumar and Arbogast’s recent Regional Economist article “Who’s Driving a Recent Decline in Life Expectancy?” for a look at life expectancy in the U.S. and other G-7 countries.
Citation
ldquoThe Impact of the Death Rate on the Graying of America,rdquo St. Louis Fed On the Economy, July 18, 2023.
This blog offers commentary, analysis and data from our economists and experts. Views expressed are not necessarily those of the St. Louis Fed or Federal Reserve System.
Email Us
All other blog-related questions