


Supply Chain Disruptions and Inventory Dynamics
In the aftermath of the COVID-19 pandemic, global economic activity was severely impacted by supply chain disruptions. Producers of intermediate inputs could not keep up with demand for their goods, either because of the direct impact of COVID-19 or because of the sluggish adjustment of supply. As a result, the operations of firms that relied on such intermediate inputs were significantly affected. For instance, shortages of semiconductors, a critical input in the production of automobiles, led to an unprecedented persistent decline of car production in the U.S. and other countries.
Firms often rely on holding inventories of key inputs as a strategy to buffer against such supply chain shocks. Had U.S. car manufacturers held sufficient inventories of semiconductors and other critical inputs at the onset of the pandemic, the industry might have weathered the disruptions more effectively. However, inventory holdings come with their own set of challenges, including the costs of storage, upfront payments and potential depreciation. These factors determine firms’ optimal inventory choices; businesses must balance the benefits of insuring against supply-chain disruptions and other shocks, vis-à-vis the costs of maintaining inventories.
In this blog post, we investigate the dynamics of inventory holdings of intermediate inputs in the U.S. prior, during and after COVID-19.
Inventories of Intermediate Inputs before the Pandemic
We begin by examining the dynamics of U.S. input inventories relative to total expenditures on intermediates, as well as relative to total sales (see the first figure). We used data from the U.S. Census Bureau’s Manufacturers’ Shipments, Inventories and Orders survey on inventories of materials and supplies, and the value of shipments. We supplemented this with data on intermediate expenditures from the Bureau of Economic Analysis. We restricted attention to the manufacturing industry.
The first figure shows that input inventories modestly decreased relative to sales and intermediates expenditures from 2000 to about 2007. This secular decline may reflect the adoption of a “just-in-time” inventory model, whereby inventory holdings are minimized, and the goal is to receive the goods as close as possible to when they are actually needed.
One issue with the just-in-time inventory model is that it relies on supply chains running smoothly, exposing firms’ operations to a vast array of shocks. And indeed, two major events took place between 2007 and 2011. The first such event was the global financial crisis of 2007-09, which had a persistent, disruptive impact on the global economy. The second event was the 2011 Tōhoku earthquake and tsunami in Japan, which severely disrupted the operations of Japanese and many global firms, particularly ones operating under the just-in-time model.See Christoph E. Boehm, Aaron Flaaen and Nitya Pandalai-Nayar’s 2019 article “Input Linkages and the Transmission of Shocks: Firm-Level Evidence from the 2011 Tōhoku Earthquake” in The Review of Economics and Statistics.
Following these events, starting around 2014, input inventories have tended to increase. One possibility is that the devastating impact of the financial crisis led firms to tighten their operations, updating their belief in the need for resiliency as a desirable objective. Even two years after the onset of COVID-19, inventory holdings remain at record levels.
U.S. Input Inventories
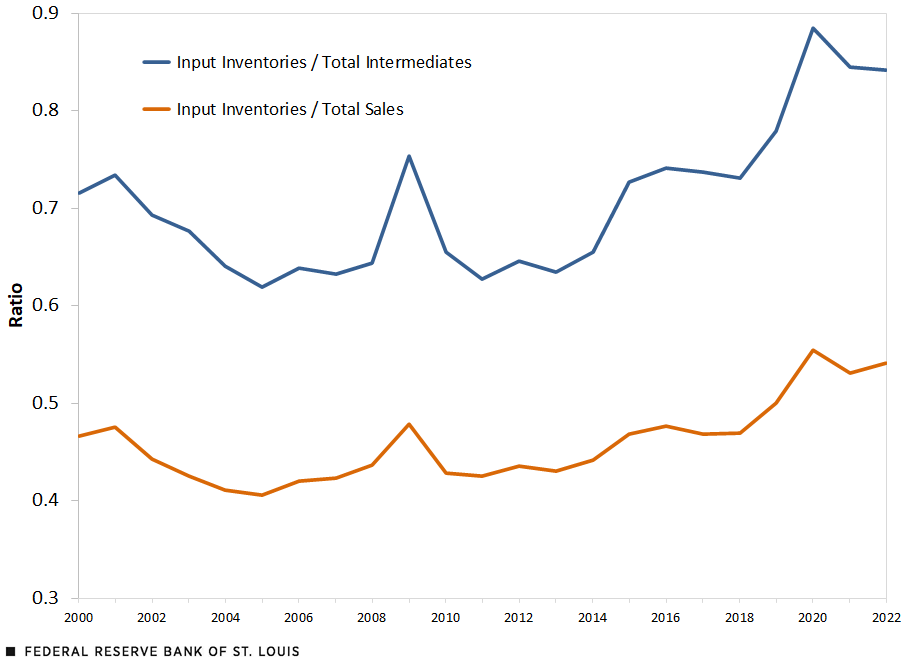
SOURCES: U.S. Census Bureau, Bureau of Economic Analysis and authors’ calculations.
Inventories of Intermediate Inputs since the Onset of COVID-19
The more recent surge in inventory shares during COVID-19 may be accounted for either by an increase of input inventories or by a decrease of sales. To explore this, we identified monthly U.S. materials and supplies inventories and total sales, relative to those in January 2020. The second figure shows that at the outset of the COVID-19 crisis, sales plummeted. This was the main driver in the initial increase of the inventory-to-sales ratio. Through the first few months of the pandemic, however, sales quickly recovered, and inventories remained consistently higher than sales (relative to January 2020 levels) over the next two years.
Input Inventories and Sales: COVID-19 and Its Aftermath

SOURCES: U.S. Census Bureau and authors’ calculations.
These data show input inventory levels have increased substantially following the outbreak of COVID-19, increasing more than total sales—thus leading to an increase in the ratio of input inventories to total sales. While many factors may account for these dynamics, one possibility is that an unexpected global event such as a pandemic led firms to further update their expectations about the probability of shocks that may disrupt their operations. This may have then led them to update their needs for inventories as a way to insure themselves against the potential of such shocks.
Another possibility is that the current high input inventory levels are part of a longer-term trend, given a higher reliance by firms on imported intermediates. Imported intermediate goods are inherently more inventory-intensive than domestically purchased inputs because global trade and shipping times are more volatile than domestic transit. As firms become more globally interconnected, they will come to rely on these imported intermediates more, and should adjust their inventory holdings accordingly.For more on this trade issue, see George Alessandria, Joseph P. Kaboski and Virgiliu Midrigan’s 2010 article “Inventories, Lumpy Trade and Large Devaluations” in American Economic Review, and Maria-Jose Carreras-Valle’s 2021 working paper “Increasing Inventories: The Role of Delivery Times” (PDF).
Prioritizing Resilience
In conclusion, our exploration of the trends in firms’ input inventory-to-sales ratios suggests a shifting balance between resilience and efficiency. This balance is shaped by both current economic conditions and firms’ expectations about future disruptions. Given the interconnectedness of the global economy and the recent shocks it has experienced, firms appear to be prioritizing resilience, reflected in the record levels of inventories they are currently holding.
Notes
- See Christoph E. Boehm, Aaron Flaaen and Nitya Pandalai-Nayar’s 2019 article “Input Linkages and the Transmission of Shocks: Firm-Level Evidence from the 2011 Tōhoku Earthquake” in The Review of Economics and Statistics.
- For more on this trade issue, see George Alessandria, Joseph P. Kaboski and Virgiliu Midrigan’s 2010 article “Inventories, Lumpy Trade and Large Devaluations” in American Economic Review, and Maria-Jose Carreras-Valle’s 2021 working paper “Increasing Inventories: The Role of Delivery Times” (PDF).


Citation
Jason Dunn and Fernando Leibovici, ldquoSupply Chain Disruptions and Inventory Dynamics,rdquo St. Louis Fed On the Economy, Aug. 7, 2023.
This blog offers commentary, analysis and data from our economists and experts. Views expressed are not necessarily those of the St. Louis Fed or Federal Reserve System.
Email Us
All other blog-related questions