


Peaks in Housing Construction as a Recession Signal
Economists have long known that trends in housing construction and sales are important indicators of future real gross domestic product (GDP) growth. The 2001-09 housing boom and bust was the latest example of this phenomenon. Indeed, some economists have gone so far as to claim that “housing really is the business cycle.”See Edward E. Leamer’s article, “Housing Really Is the Business Cycle,” in the March/April 2015 issue of the Journal of Money, Credit and Banking.
One key measure of U.S. housing construction is the number of residential units currently under construction, which is reported monthly by the U.S. Census Bureau. Units under construction are listed as single unit, two to four units, and five or more units. Multifamily construction is the sum of the second and third categories. The figure below plots each of these measures since the series’ first observation in January 1970.
Single, Multifamily and Total Housing Units under Construction
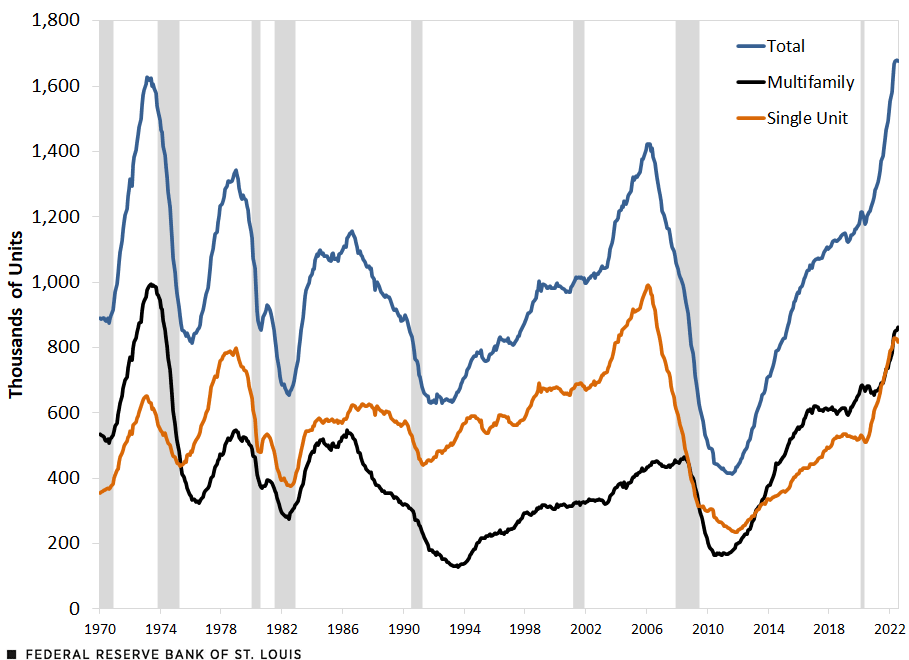
SOURCES: Census Bureau and Haver Analytics.
NOTE: Shaded areas indicate recessions.
This figure shows that housing construction has boomed since early 2020, with the total number of residential units under construction rising to a record high in June 2022; units then fell slightly in July. The boom in construction has been broad-based, as both single- and multifamily units under construction have risen sharply—though each category remains below its previous peak of February 2006 and May 1973, respectively. Except for the period associated with the 2020 COVID-19 recession, units under construction peaked before recessions occurred.
The following figure shows that the record surge in total housing units under construction has also pushed nominal private residential construction to a record high this year. Private residential construction data, also reported by the Census Bureau, are a monthly estimate of “the total dollar value of construction work done in the U.S.” Similar to units under construction, nominal private residential construction expenditures usually peak before recessions.
Private Residential Construction
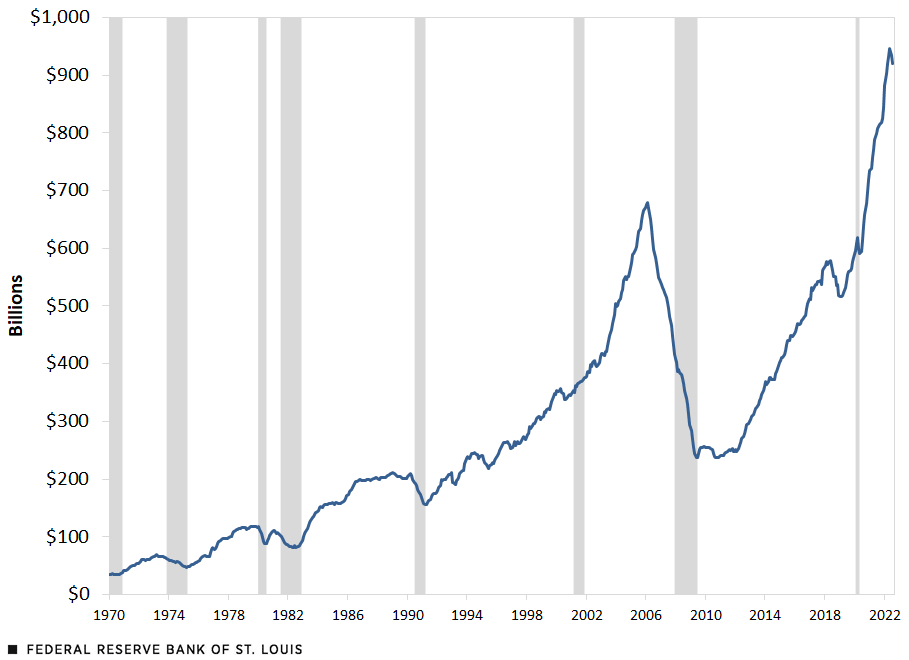
SOURCES: Census Bureau and Haver Analytics.
NOTE: Shaded areas indicate recessions.
It takes several months to build a house. For instance, in 2021, the average length of time from start to completion for single-unit buildings ranged from 6.5 months to 12.1 months, depending on whether the unit was built for sale, built by a contractor or built by the owner. The time to completion for multifamily units ranged from 11.9 months to 17.2 months, depending on the number of units.See the Census Bureau for this data (PDF). Thus, the recent record number of housing units under construction suggests that private residential construction will increase further in the future.
However, private residential construction declined by more than 1% in both June and July 2022. Given the timing noted above, it is possible that this two-month decline in private residential construction activity is a temporary lull. And indeed, false peaks have occurred in the past. Still, this development raises an interesting set of questions. First, is it always the case that the number of units under construction hits a peak before total private residential construction? If so, what is the average percentage increase in nominal residential construction spending after the peak in units under construction? Second, when does each series peak before the onset of a recession?
The table below strives to answer these questions. To keep the analysis manageable, it looks at total housing units under construction rather than units under construction by category.
| Episode | Peak in Housing Units under Construction (A) | Peak in Private Residential Construction (B) | Number of Months from Peak in Units under Construction to Peak of Private Residential Construction (C) | % Change in Private Residential Construction from Peak in Units under Construction to Peak Residential Construction (D) | Business Expansion Peak (E) | Number of Months from Peak in Units under Construction to Peak in Business Expansion (F) | Number of Months from Peak in Private Residential Construction to Peak in Business Expansion (G) |
|---|---|---|---|---|---|---|---|
| 1973 | February 1973 | March 1973 | 1 | 1.4% | November 1973 | 9 | 8 |
| 1980 | December 1978 | October 1979 | 10 | 1.9% | January 1980 | 13 | 3 |
| 1981 | N/A | January 1981 | N/A | N/A | July 1981 | N/A | 6 |
| 1990 | August 1986 | January 1989 | 29 | 8.1% | July 1990 | 47 | 18 |
| 2001 | December 1998 | April 2000 | 16 | 17.7% | March 2001 | 27 | 11 |
| 2008 | January 2006 | February 2006 | 1 | 0.4% | December 2007 | 23 | 22 |
| 2020 | March 2020 | February 2020 | -1 | -1.7% | February 2020 | -1 | 0 |
| SOURCES: Bureau of Labor Statistics, National Bureau of Economic Research and author’s calculations. | |||||||
Columns A and B note the peak month for each series—total housing units under construction and nominal private residential construction, respectively—since the end of the 1969-70 recession in November 1970. As column C shows, five of the seven episodes during this period registered gains in nominal private residential construction after the peak in total housing units under construction. However, the range of time between peaks was large, from one month to 29 months. The single episode when private residential construction peaked before units under construction was during the 2020 recession. On average (median value), units under construction peaked six months before the peak in private residential construction.Units under construction continued to decline between the 1980 and 1981-82 recessions.
Column D reports the percentage change in private residential construction after the peak in units under construction. The median increase was 1.7%, but the range of increases was quite large, from 0.4% to 17.7%. As noted above, in the 2020 episode, private residential construction peaked in February 2020, one month before the peak in units under construction. In this instance, private residential construction fell 1.7%.
Column E lists the peak month in business activity, as identified by the National Bureau of Economic Research Business Cycle Dating Committee, associated with each episode. Columns F and G note the time in months from the peak in total housing units under construction and the peak in nominal private residential construction, respectively, to the business expansion peak. The analysis shows that, in general, both series peak before recessions, but the timing differs.
- Units under construction peaked at a median of 18 months before the business expansion peak. The range of time between these peaks was quite large, from one month to 47 months. This is reported in column F.
- Private residential construction peaked at a median of eight months before the business expansion peak. The range of time between these peaks was also quite large, from zero to 22 months. This is reported in column G.
Based on the analysis in this blog post, the peak in private residential construction in May 2022 (if that turns out to be the peak) one month before the peak in units under construction is unusual, though not unprecedented, as seen in the 2020 recession. Thus, it is possible that nominal private residential construction put in place could rebound following the declines in June and July. If not, history suggests that the next recession could begin sometime in 2023.
Cassandra Marks, a research associate at the Federal Reserve Bank of St. Louis, contributed to this blog post.
Notes
- See Edward E. Leamer’s article, “Housing Really Is the Business Cycle,” in the March/April 2015 issue of the Journal of Money, Credit and Banking.
- See the Census Bureau for this data (PDF).
- Units under construction continued to decline between the 1980 and 1981-82 recessions.

Citation
Kevin L. Kliesen, ldquoPeaks in Housing Construction as a Recession Signal,rdquo St. Louis Fed On the Economy, Sept. 29, 2022.
This blog offers commentary, analysis and data from our economists and experts. Views expressed are not necessarily those of the St. Louis Fed or Federal Reserve System.
Email Us
All other blog-related questions