


Are Mortgages Becoming More Affordable?
A household’s mortgage payment relative to income is a good measure of mortgage affordability; a lower monthly payment-to-income ratio indicates that borrowers use less of their income on housing. From June 2021 to June 2022, nominal wage growth increased significantly for many U.S. households with preexisting mortgages. The higher income benefited these households because their loan payments remained fixed. However, other expenses, which also increased, may offset this improvement.
This blog post estimates the median payment-to-income ratio over time for two groups of mortgage loans to evaluate mortgage affordability. It is limited to households that took out their mortgages before the COVID-19 pandemic. This caveat is critical because households that bought houses after the pandemic may have paid more, given the significant increase in house prices during the last two years.
The data come from the Home Mortgage Disclosure Act and Black Knight’s McDash (HMDA-McDash) data sets, which provide information on borrowers and mortgages. The first group consists of loans originating in the first quarter of 2015, and the second group consists of loans originating in the first quarter of 2019. We follow both groupsFor each group, we retain only loans with borrower income listed and present throughout the 37 months. for three years after origination. Although the data sets contain monthly information on mortgage payments, there is no equivalent monthly update on mortgagors’ labor earnings. So the monthly series on labor income is an estimation based on (1) the borrowers’ income at loan origination reported by HMDA-McDash and (2) the median wage growth from the Federal Reserve Bank of Atlanta’s Wage Growth Tracker.The wage growth is given year over year. We apply the February wage growth for year t+1 (one year after origination) to the average income of the first-quarter origination group in year t (the year the mortgage was originated). This method gives the estimated average income for February in year t+1. Then we interpolate the income values for the months between the two values. After doing so, we can use the wage growth each month to estimate the income values for the next two years.
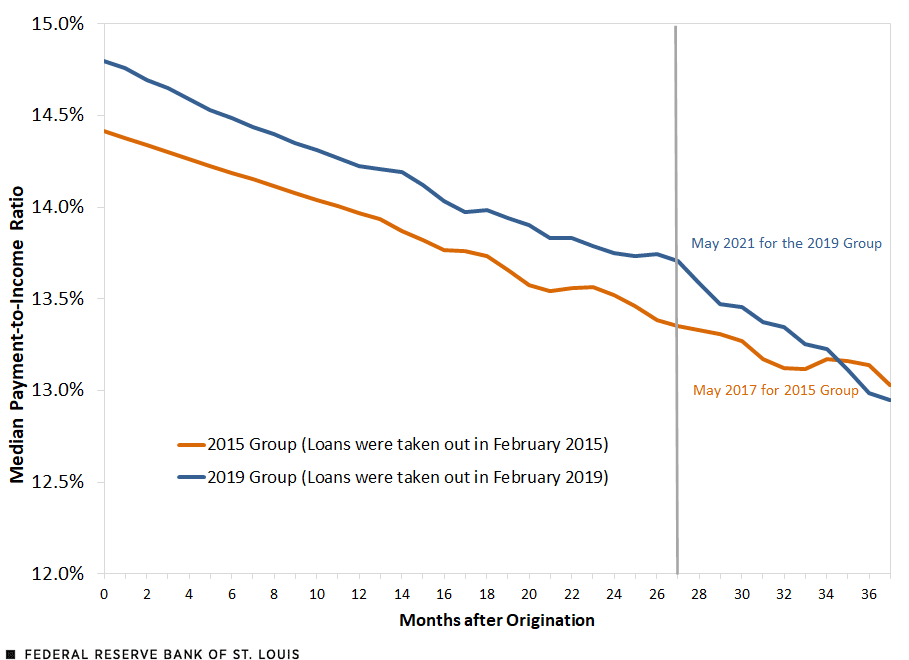
The figure below displays the median payment-to-income ratio over time for the two groups of loans. Both groups had very similar payment-to-income ratios at origination: The February 2015 group had payments of 14.4% of monthly income, and the February 2019 group paid 14.8% of monthly income. In the following 27 months, the two groups’ median monthly payments remained nearly parallel. At that point, the older group had payments of 13.4% of monthly income, and the younger group paid 13.7% of monthly income.
Monthly Mortgage Payment-to-Income Ratio Started Declining Faster for 2019 Group in 2021
SOURCES: Home Mortgage Disclosure Act and Black Knight’s McDash (HMDA-McDash) data sets, Federal Reserve Bank of Atlanta’s Wage Growth Tracker, and authors calculations’.
In June 2021, the 2019 group’s median payment-to-income ratio began declining more rapidly due to the faster increase in wages starting in mid-2021; the 2015 group saw no similar wage gains starting in the summer of 2017. Consequently, 37 months after origination, the payment-to-income ratios were 13.03% for the February 2015 group of mortgages and 12.95% for the February 2019 group of mortgages. The comparison ends at 37 months because, at the time of writing, there are no data on mortgage payments after March 2022. However, recent information on wage growth suggests that this trend continues.
Notes
- For each group, we retain only loans with borrower income listed and present throughout the 37 months.
- The wage growth is given year over year. We apply the February wage growth for year t+1 (one year after origination) to the average income of the first-quarter origination group in year t (the year the mortgage was originated). This method gives the estimated average income for February in year t+1. Then we interpolate the income values for the months between the two values. After doing so, we can use the wage growth each month to estimate the income values for the next two years.


Citation
Juan M. Sánchez and Olivia Wilkinson, ldquoAre Mortgages Becoming More Affordable?,rdquo St. Louis Fed On the Economy, Sept. 8, 2022.
This blog offers commentary, analysis and data from our economists and experts. Views expressed are not necessarily those of the St. Louis Fed or Federal Reserve System.
Email Us
All other blog-related questions