The Pandemic Surge in Business Applications
Several instances of unusual economic activity occurred during the COVID-19 pandemic, one of which was the influx of business applications. In a March Economic Synopses essay, St. Louis Fed Assistant Vice President Guillaume Vandenbroucke and Victoria Yin, a former research intern, examined that spike in business applications.
The authors used data on business applications from Business Formation Statistics provided by the U.S. Census Bureau; the data include all applications for an employer identification number in the 50 U.S. states and Washington, D.C.
Recession Comparison
To measure how sizable the influx of business applications was after the start of COVID-19 recession, Vandenbroucke and Yin compared it to the flow of applications during the 2007 recession.
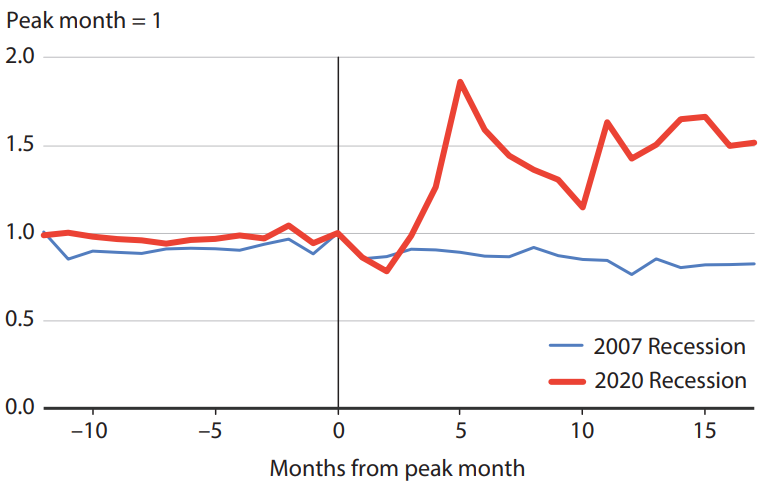
In the figure below, month 0 is the peak month before a recession, the authors wrote. That means December 2007 for the Great Recession and February 2020 for the pandemic recession.
The number of monthly business applications are normalized to 1 in month 0 to compare both recessions, they wrote. Therefore, a value of 1 translates to no change relative to the start of the recession. A value of 0.9 implies 10% fewer applications than at the start of the recession, while a value of 1.1 means 10% more.
Business Applications in the U.S. during the 2007 and 2020 Recessions

NOTE: The figure shows all business applications in the U.S. before and after the peak months of the 2007 and 2020 recessions.
SOURCE: U.S. Census Bureau, Business Formation Statistics.
Noting that business applications were stable before each recession, the authors observed that applications dropped about 15% about a month after each recession started. But that’s when the similarities ended.
In July 2020, five months after month 0, business applications were 86% above what they were in February, the authors found. During the same period in 2007, business applications were 10% lower and fell further.
“In total, there were over 1.1 million more business applications in the 12 months after February 2020 than in the 12 months before February 2020—a 34% increase,” Vandenbroucke and Yin wrote. “In comparison, there were 130,000 fewer business applications in the 12 months after December 2007 than in the 12 months before December 2007—a 5% decline.”
Breakdown by Sector
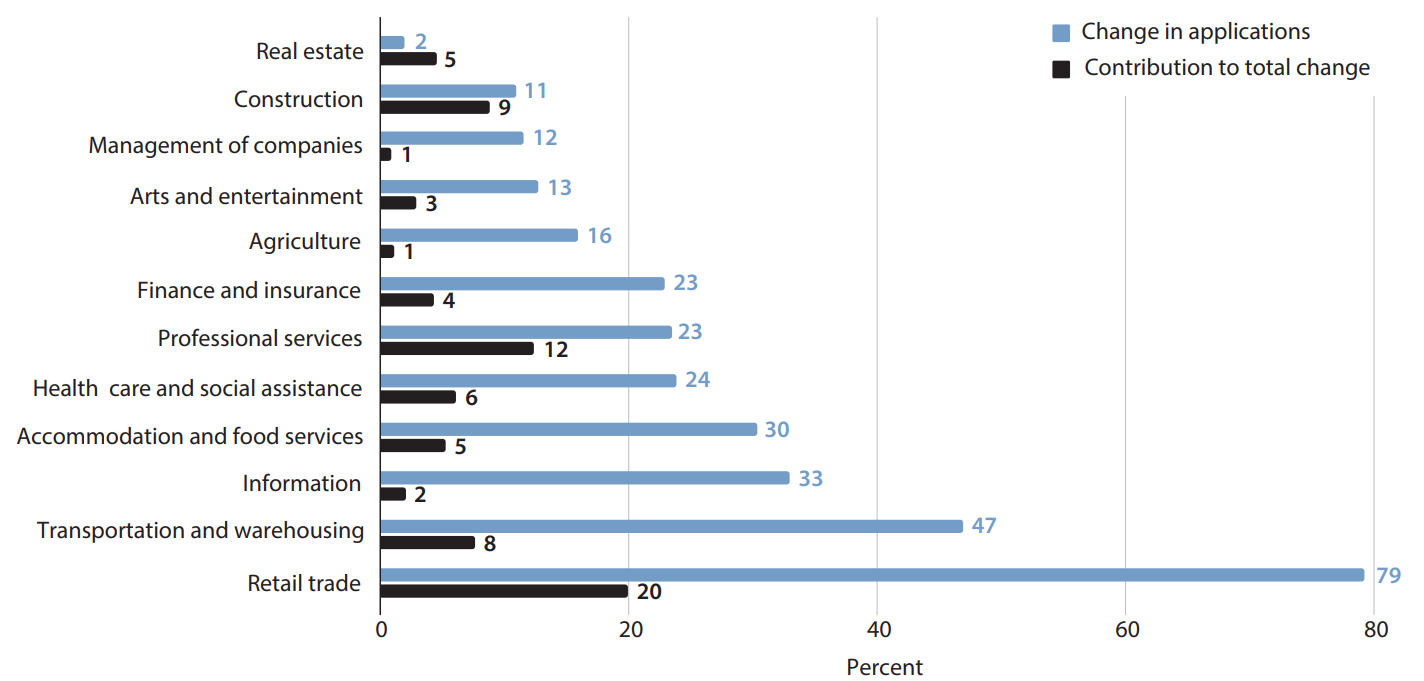
While business applications increased during the pandemic, the authors found that applications did not grow uniformly by industry. In the figure below, they charted the percentage increase of total business applications by sector in the 12 months after February 2020, relative to the total in the 12 months before February 2020 (blue bars). They also reported the contribution of each sector to the total increase in business applications (black bars).
Percent Change in Total Business Applications, 2019-2021

NOTE: The bars show the percent change in total business applications from the 12 months before February 2020 to the 12 months after February 2020 (blue) and the contribution to total change in business applications (black).
SOURCE: U.S. Census Bureau, Business Formation Statistics.
The retail trade sector had the largest jump in applications—a 79.2% increase, representing 20% of the total increase in applications. The real estate sector had the smallest increase—2%, representing 5% of the total increase.
Vandenbroucke and Yin noted that an important question remained: whether COVID-19 sparked an atypically large surge in business failures. They wrote that this type of data is generally not as available. However, the authors cited a 2020 paper by Leland D. Crane and other economists that estimated business shutdowns during the pandemic using payroll data.
Crane and his co-authors “find a peak in business closures lasting at least 36 days around mid-May 2020. Business closures at that time were 6% higher than their historical average. They also find a modest peak (2% above the historical average) in more permanent closures of 70 days or longer,” Vandenbroucke and Yin wrote. “By August/September 2020, however, business closures had returned to their historical averages.”
Conclusion
The data indicate that business applications have been on the rise and business closures may be returning to normal, Vandenbroucke and Yin observed, adding that this suggests a venue for joblessness to decline and stay low.
However, questions do remain. The authors wondered how many employees the new businesses would hire or how likely the businesses are to survive.
Vandenbroucke and Yin looked at how the Census divides business applications between “high-propensity business applications” and all other business applications. High-propensity applications are the most likely to turn into businesses with employees.
“Total high-propensity business applications increased 23% in the 12 months after February 2020, relative to the total in the 12 months before February 2020,” they wrote. “A total of 1.6 million high-propensity businesses were created between March 2020 and February 2021, helping with the reduction in unemployment during this period.”
Citation
ldquoThe Pandemic Surge in Business Applications,rdquo St. Louis Fed On the Economy, Oct. 11, 2022.
This blog offers commentary, analysis and data from our economists and experts. Views expressed are not necessarily those of the St. Louis Fed or Federal Reserve System.
Email Us
All other blog-related questions

