


Taking the Long View on Gasoline Prices, Demand
U.S. consumers closely watch the twists and turns of gasoline prices, with many hunting for the lowest pump price or reducing consumption if prices are very high. But how do volatile fuel prices and consumer demand track over the long run?
In a June Economic Synopses essay, St. Louis Fed Senior Vice President B. Ravikumar and Research Associate Iris Arbogast examined long-term trends of motor gasoline prices and demand, as well as gasoline spending’s significance to the U.S. economy.
Fueling Gasoline Price Increases
The authors first looked at how increases in regular gasoline prices compared with increases in consumer prices, as measured by the consumer price index (CPI). (See their figure below.) They found that average yearly CPI inflation was 2.4% from 1990 to 2021, while gasoline price inflation averaged 3.9% annually during that period.
Monthly U.S. Regular Gasoline and CPI Price Comparison
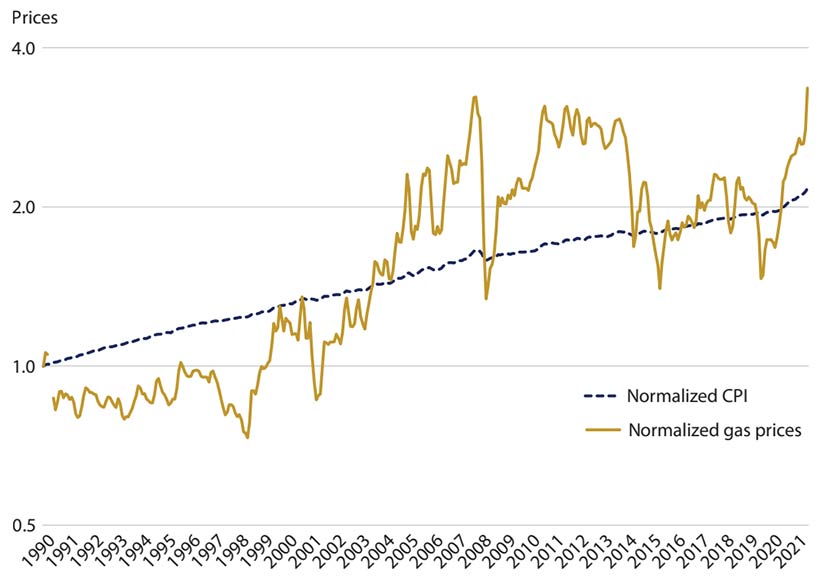
NOTE: In this figure, prices are normalized to 1 in 1990 and plotted on a logarithmic scale with base 2.
SOURCES: U.S. Energy Information Administration, Bureau of Economic Analysis and authors’ calculations.
Why did gasoline prices increase over roughly the past decade? It doesn’t appear to be rising demand for the fuel, the authors observed. Looking at motor gasoline demand, they found that annual consumption steadily increased from 1990 to 2006, when it reached 80.4 million gallons. But it then began to decrease before slowly recovering. By 2019, demand was 80.9 million gallons, little changed from 2006, they observed. (A detailed figure of gasoline demand is available in their Economic Synopses essay.)
So how significant is gasoline spending to the overall U.S. economy? To answer that, Ravikumar and Arbogast tracked U.S. motor gasoline expenditures as a percentage of gross domestic product (GDP).
Gasoline spending as a percentage of GDP was only 1.7% in 2019 versus 2.1% in 1990, the authors noted. (A detailed figure of gasoline expenditures as a percentage of GDP is available in their Economic Synopses essay.)
“We conclude that gasoline price increases over the past decade have not been driven by a long-term increase in demand, nor have they led to a significant increase in gasoline expenditures as a proportion of GDP,” they wrote.
Citation
ldquoTaking the Long View on Gasoline Prices, Demand,rdquo St. Louis Fed On the Economy, Nov. 17, 2022.
This blog offers commentary, analysis and data from our economists and experts. Views expressed are not necessarily those of the St. Louis Fed or Federal Reserve System.
Email Us
All other blog-related questions