


Breaking Down the Contributors to High Inflation
The Recent High Inflation Rate
One of the major challenges currently facing Federal Reserve policymakers is the sudden rise in the inflation rate first observed in the second half of 2021. The annual rate of personal consumption expenditures (PCE) inflation increased substantially, from 1.41% in January 2021 to 6.06% in January 2022. Similarly, the annual inflation measure using the consumer price index (CPI) exhibits the same upward trend. Facing this sudden surge of the PCE inflation rate well above its 2% target, the Federal Reserve decided on March 16 to increase the target range for the federal funds rate by 25 basis points, signaling the start of a rate hike cycle to combat inflation. The strength and magnitude of the Fed’s potential future rate hikes critically depend on the dynamic path of inflation in the coming months. This blog post first decomposes the recent high inflation rate into the inflation contributions of various consumption components and then briefly discusses the underlying driving forces.
Breaking Down the PCE Price Index
Produced monthly by the Bureau of Economic Analysis (BEA), the PCE price index comprises many different goods and services. There are three main components:
- Durable goods (e.g., long-lasting products such as household items and motor vehicles)
- Nondurable goods (e.g., clothes and gasoline)
- Services (e.g., health care and housing expenditures)
The inflation rate is the percentage change in the price index. As a result, price increases of various goods and services contribute to the overall inflation rate.
We decomposed the overall PCE inflation rate into its components and compare the breakdown of the current high inflation rate (as of January 2022) to the breakdown of the average inflation rate over the previous expansion period (July 2010 to January 2020). In doing so, we can identify the drivers of the current high inflation rate. The inflation contribution of each component is approximated by multiplying its inflation rate by its consumption share. The sum of the inflation contributions for each component is about equal to the overall PCE inflation rate.
The Decomposition of Recent High Inflation
The following figure reports the inflation contributions of the three main components of PCE to the current inflation rate (blue bars) and average inflation rate during the previous expansion (orange bars). The gray bars indicate the difference between the two contributions.
Inflation Contributors in Main PCE Categories
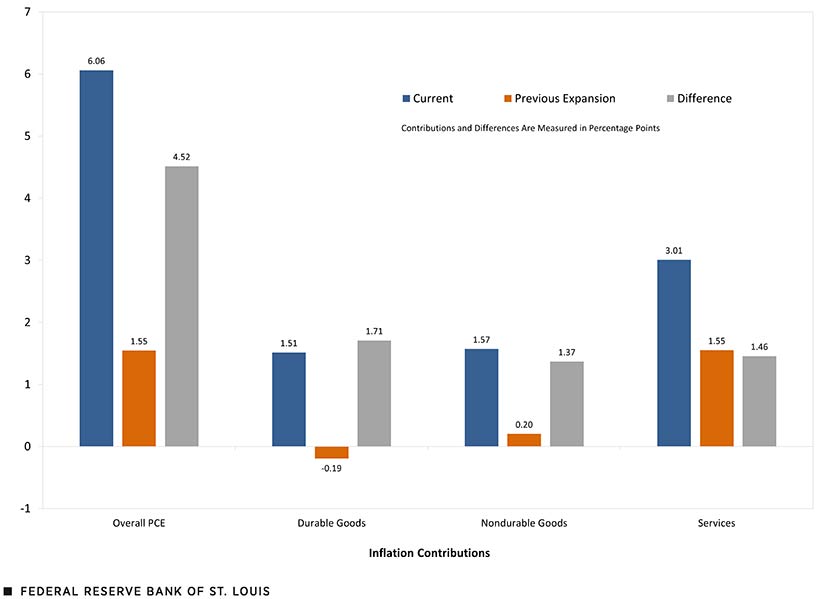
SOURCES: BEA and authors’ calculations.
NOTES: “Current” is as of January 2022; “Previous Expansion” refers to the period from July 2010 to January 2020.
Clearly, the inflation contributions for all three major components are significantly higher for the current inflation rate compared with those for the inflation rate in the previous expansion period. The increase in the inflation contribution of durable goods is especially notable. The inflation contribution went up from a negative level of -0.19 percentage points during the previous expansion to 1.51 percentage points at the beginning of this year. Given that durable goods account for only 13% of total consumption expenditures, the inflation contribution of 1.51 percentage points indicates that the inflation rate of durable goods exceeds 11%. One of the major contributors to such a high durable goods inflation rate is the 61% price surge for used autos. Pandemic-related supply chain disruptions for automobile inputs, such as parts and computer chips, limited the production of new vehicles and hence drove up the prices for used autos in recent months.
Inflation’s Connection with Oil Prices
As evidenced by the figure, nondurable goods inflation has also contributed significantly to the recent high inflation rate. The nondurable goods inflation rate is 7.2%; since it has a 22% share of overall PCE, this inflation contributes 1.57 percentage points to the overall inflation rate. This is a substantial increase from nondurable goods’ mere 0.20 percentage point average inflation contribution in the pre-pandemic expansion. The increase is mostly due to the rise of gasoline prices, which is closely related to the rise in oil prices.
During the previous expansion, oil production—especially the oil production using new fracking technology—increased significantly starting in 2011 and reached its peak around the end of 2019, as shown in the next figure. The increase in domestic oil production suppressed the inflation rate of energy prices during the previous expansion. U.S. tight oil production declined during the pandemic and has not yet recovered to its pre-pandemic level. The shortage of domestic oil production could then be one important driving force behind recent high inflation.
Nondurable Goods Inflation and U.S. Fracking Oil Production
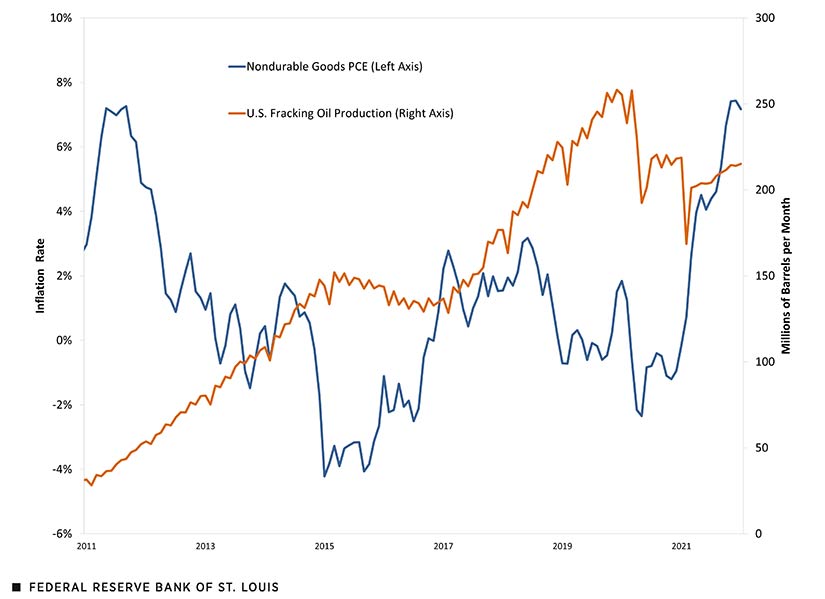
SOURCES: BEA, U.S. Energy Information Administration and authors’ calculations.
The rise of the services inflation rate has been relatively modest so far, especially compared with those of durable and nondurable goods. The recent services inflation rate is 4.62%, compared with a 2.28% average in the previous expansion. However, services account for 65% of total consumption expenditures; hence, its inflation contribution is amplified by its large consumption share relative to goods. The inflation contribution rose from 1.55 percentage points in the previous expansion period to 3.01 percentage points in the most recent data.
A Concern of Housing Services Inflation
Even though the services inflation rate might look relatively modest so far, there is a concern that services inflation could trend upward in the coming months. One of the concerns stems from the significant increase in housing prices, which tends to be a leading indicator of housing services (the price of rent and utilities). As housing prices go up, it is likely that landlords ask for higher rents to secure the same level of return. The current rent adjustment has been more gradual, though, and lags the changes of housing prices.
The next figure provides supporting evidence. It indicates a positive relationship by aligning reported housing services inflation for a given date with reported housing price inflation from 12 months prior (lagged 12 months).
House Price Inflation and Housing Services (Rent) Inflation
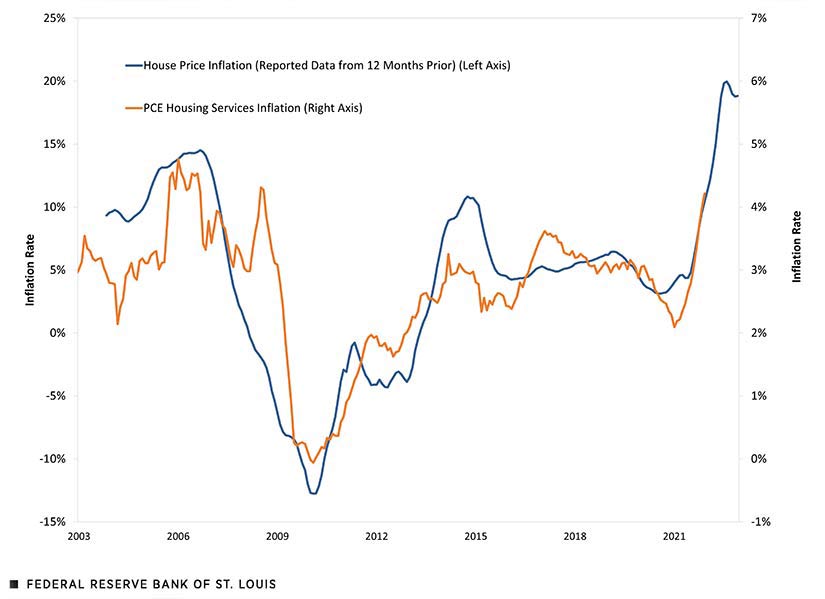
SOURCES: S&P/Case-Shiller and BEA.
NOTES: The figure shows current housing services inflation for a given date with the reported housing price inflation from 12 months prior (lagged 12 months). For example, 2021 on the x-axis marks the housing price inflation in December 2020 and housing services inflation for December 2021.
Clearly, there is an upward trend in the recent housing services inflation rate, which possibly reflects the surge of home prices in the prior year. However, given the large increase in housing values throughout 2021, the inflation pressure of housing services is likely to continue. Most real estate-related websites—such as ApartmentList.com and Zumper.com—have reported substantial rent price increases both nationally and by geographic breakdown. Given that housing services constitutes the largest subcomponent of PCE, accounting for roughly 18% of total consumption expenditures, the impact of housing services inflation on overall PCE inflation is always significant. Hence, a continued increase in housing services inflation could keep the overall PCE inflation rate at an elevated level.
In short, the recent price surge of durable and nondurable consumption goods contributes greatly to the overall PCE inflation rate. In addition, the recent large increase of housing values is likely to contribute significantly to the overall PCE inflation rate in the coming months.


Citation
YiLi Chien and Julie Bennett, ldquoBreaking Down the Contributors to High Inflation,rdquo St. Louis Fed On the Economy, March 28, 2022.
This blog offers commentary, analysis and data from our economists and experts. Views expressed are not necessarily those of the St. Louis Fed or Federal Reserve System.
Email Us
All other blog-related questions