


How Does Human Capital Affect Wealth Inequality?
Wealth inequality is an important issue and one of the most talked about today. It helps us understand whether participants of the economy have equal access to resources and opportunities, and it is central to redistributive policies. However, one aspect of wealth not as often discussed is each person’s time and ability that they can use to trade for other resources—their human capital with which they can work and generate income with labor.
Human capital is one of the most important sources of wealth for people outside the top of the wealth distribution because knowledge, education and skills typically determine one’s income. If we account for human capital as the net present value of people’s projected future labor income, this source of wealth adds up to nearly two times the wealth from other sources for the bottom 90% of the wealth distribution.
In this article, we investigate how accounting for human capital as a source of wealth changes the distribution of U.S. wealth and some common measures of wealth inequality.
Future Labor Income
Since human capital (i.e., future labor income) cannot be directly observed in surveys of household wealth, we imputed a rough measure of a person’s expected labor income using reported labor income from the Survey of Consumer Finances (SCF) and the growth of income over different stages of the life cycle among people with the same demographics in the survey.
We defined six different groups of households based on race (white, black or other) and education (attended college or not). We then looked at incomes across age distribution to estimate the average expected income growth path for each group, taking into account that the level of income can shift over time due to aggregate economic conditions.
After calculating the income growth rates, we computed the future expected income growth for each person given one’s age, race and college attendance to construct the expected streams of future yearly labor income. These future streams of income are discounted using 10-year constant maturity Treasury securities. We also accounted for mortality rates based on birth year to give us each person’s expected income path.
In the figure below, we plotted the total net wealth held by each household decile sorted by net wealth, including a breakdown of net wealth into labor and nonlabor wealth. We can see clearly that labor wealth is the largest source of wealth for all households except those in the top decile. And it is most important for those in the bottom decile of households in terms of wealth.
Sources of Wealth: Labor vs. Nonlabor
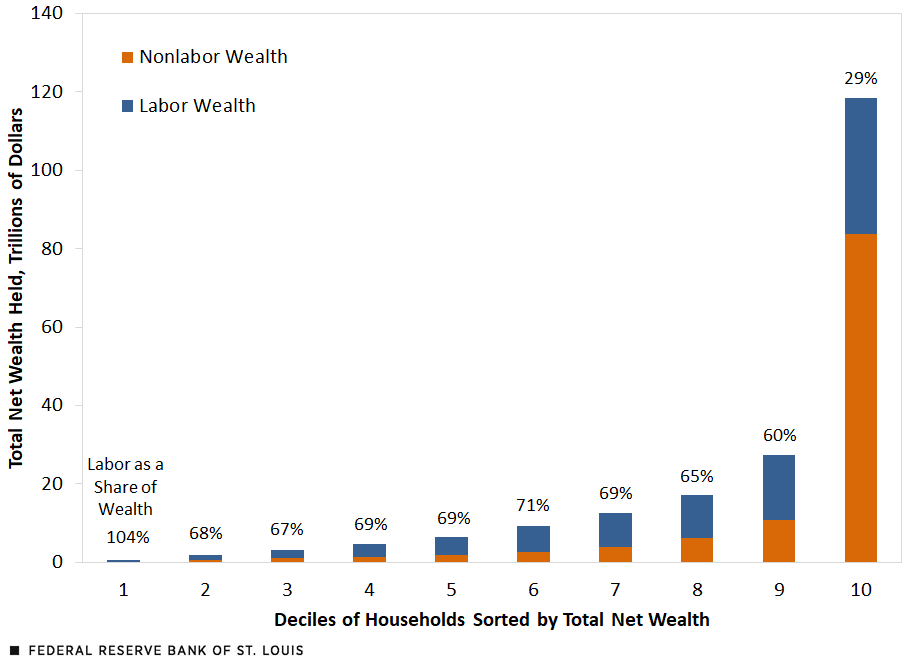
SOURCES: Survey of Consumer Finances and authors’ calculations.
For the bottom decile, labor income actually exceeds 100% of total net wealth because these households are net borrowers (they hold negative net worth) in their other forms of wealth. The importance of labor wealth remains relatively steady for deciles 2 to 9, ranging from 60% to 71% of total net wealth. However, in the top decile of households, the importance of labor wealth decreases drastically in comparison to their other assets.
Accounting for labor wealth changes how we think of the degree of wealth inequality. If we look at overall wealth excluding expected labor income, 75% of all wealth is held by the top decile. When you incorporate labor wealth, this number falls to 59%. Similarly, if you calculate the Gini coefficientThe Gini coefficient, also known as the Gini index, is a widely used measure of inequality. A coefficient of 0 means the distribution of wealth is perfectly equal, and 1 means the distribution is perfectly unequal. of our sample using the standard measure of net wealth, you get a ratio of 0.86, in line with other sources.For a more extensive review, see Credit Suisse’s 2021 Global Wealth Report. When accounting for labor wealth, however, the Gini coefficient drops to 0.69, which indicates less inequality.
The Changed Picture of Inequality
Taking labor wealth into consideration also changes the picture of rich and poor households. The demographics of this bottom decile, when accounting for labor income, skews notably older. In fact, 73% of people in this bottom decile are over the age of 55, with 45% being older than 65, commonly assumed to be retirement age.
They also have the lowest rates of homeownership and college attendance. If we calculate these numbers again using net wealth without expected labor income, the shares of older people in the bottom decile fall dramatically to 8% for those over 55 and 4% for those over 65. That’s because young people, who have accumulated fewer assets while sometimes taking on large liabilities, hold most of their wealth in the form of their expected labor income.
In addition, the share of the bottom decile that attended college is dramatically lower when labor wealth is taken into account, with only 36% under the traditional measure compared with 78% when labor income is taken into account. This reflects the inclusion of many students who expect larger labor wealth in their future.
Notes and References
1 The Gini coefficient, also known as the Gini index, is a widely used measure of inequality. A coefficient of 0 means the distribution of wealth is perfectly equal, and 1 means the distribution is perfectly unequal.
2 For a more extensive review, see Credit Suisse’s 2021 Global Wealth Report.


Citation
Yu-Ting Chiang and Jesse LaBelle, ldquoHow Does Human Capital Affect Wealth Inequality?,rdquo St. Louis Fed On the Economy, June 6, 2022.
This blog offers commentary, analysis and data from our economists and experts. Views expressed are not necessarily those of the St. Louis Fed or Federal Reserve System.
Email Us
All other blog-related questions