How Fast Will Regional Employment Return?
As economic conditions continue to improve and the worst of the pandemic-related shocks recede further into the distance, eyes have started to turn to the future. The recovery from the pandemic recession is well underway, though it’s just as uncertain in its own way as the recession was a year and a half ago. The supply chain issues that have imposed cost pressures on a range of goods and services are expected to take some time to resolve. In the labor market, firms continue to deal with labor shortages, struggling to hire even as consumer demand recovers.
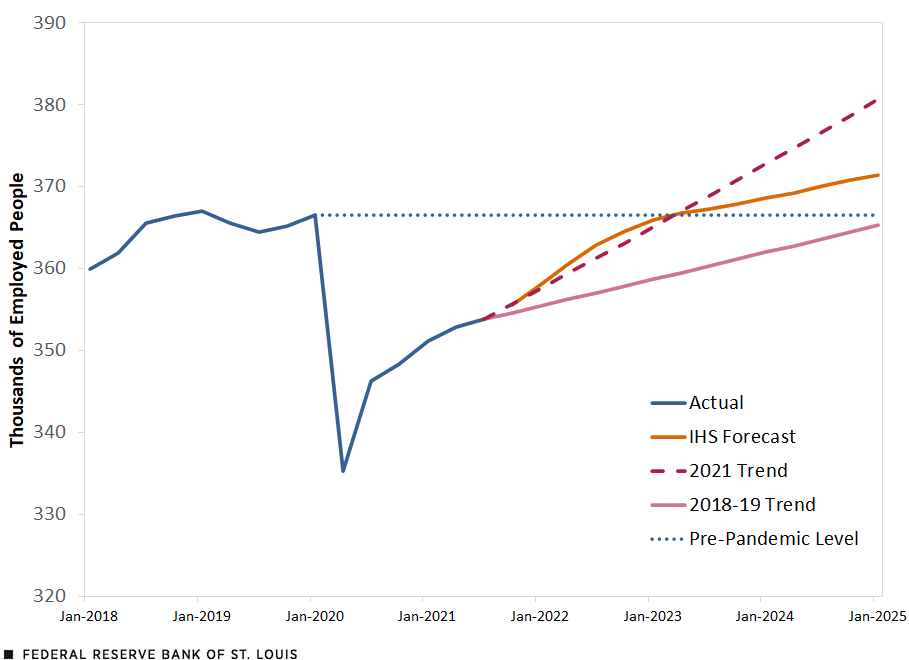
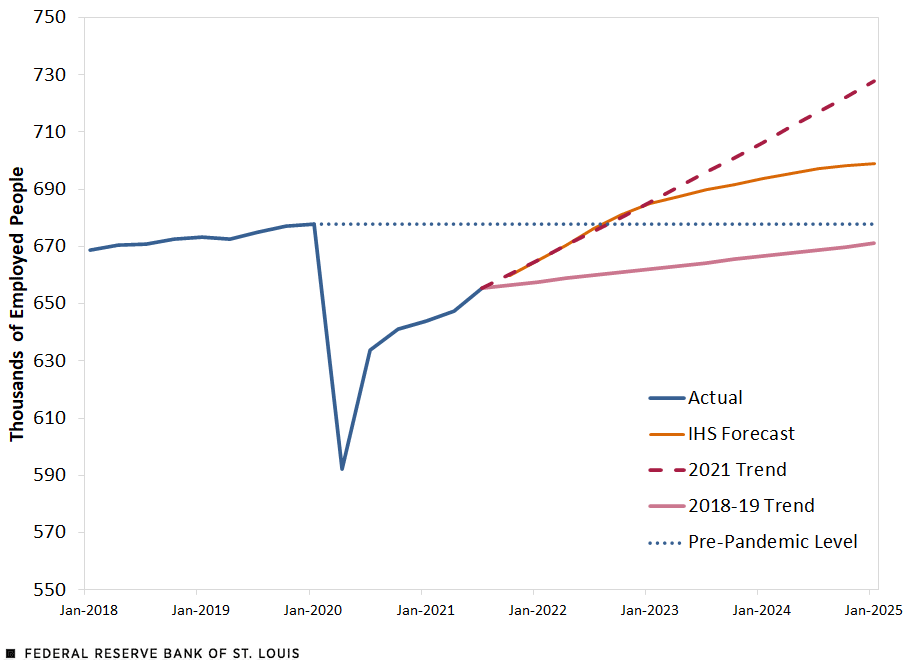
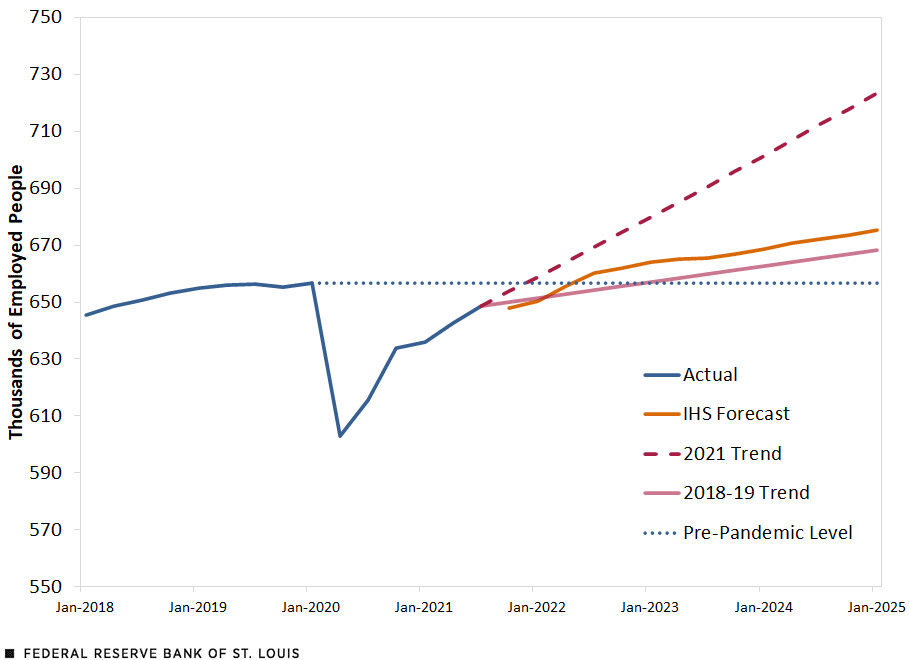
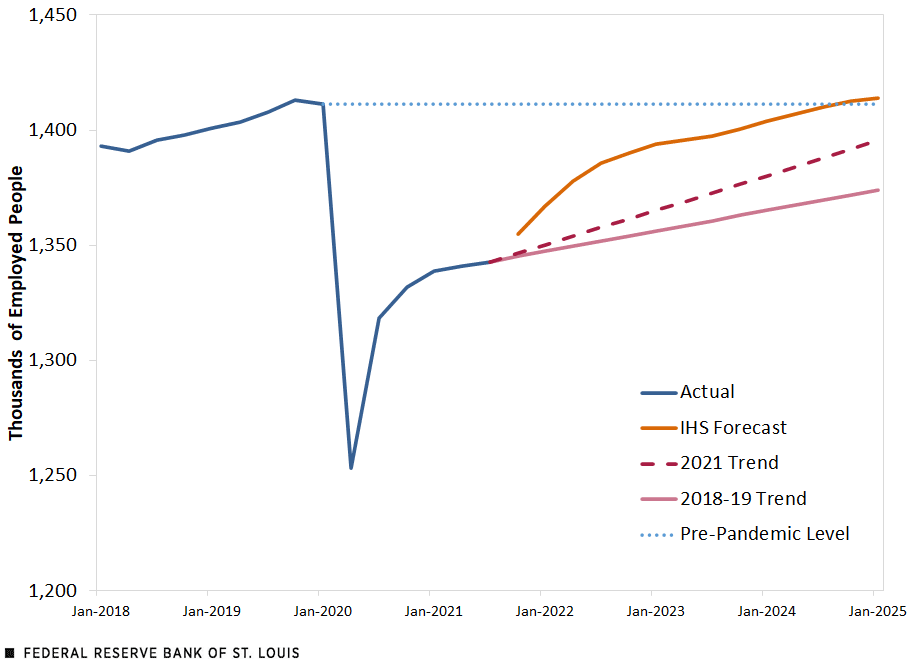
If you look at the figures below tracking nonfarm employment across the four largest metropolitan statistical areas (MSAs) in the Eighth Federal Reserve District,Headquartered in St. Louis, the Eighth Federal Reserve District includes all of Arkansas, southern Illinois, southern Indiana, western Kentucky, northern Mississippi, eastern Missouri and western Tennessee. you can see that employment (the blue line) bottomed out in the second quarter of 2020 before recovering sharply in the third quarter of 2020 and then rising steadily in 2021. While none of the District’s major metros has seen nonfarm employment (defined as the number of people on nonfarm payrolls) return to pre-pandemic levels, the rate of employment gains over the past year puts them on a positive trajectory.
But how positive is that trajectory exactly? The four figures below show model-based forecasts from IHS Markit and compare those forecasts to pre-and post-pandemic employment growth to better understand what the future may hold.IHS Markit forecast is model-based using historical data and does not incorporate information from new business developments. This model is useful in that it draws from state-level and national historical data to capture policy and demographic differences between regions.
Projecting Future Growth
Prior to the pandemic, U.S. employment growth averaged 0.3% per quarter, while all four major District MSAs averaged 0.2% per quarter. In the first three quarters of 2021, U.S. employment growth averaged 0.5% per quarter, and District MSAs experienced employment growth above pre-pandemic trend. Memphis was the highest at 0.8% quarterly growth so far in 2021, while Louisville came in at 0.7%, Little Rock at 0.5%, and St. Louis at 0.3%.
The dashed red line in each figure shows the projected employment path if growth continues at the metro area’s 2021 average growth rate. The solid red line shows the path if growth abruptly slows and returns to the 2018-19 rate. The dotted blue line extends the pre-pandemic level for visual reference. The orange line shows the IHS Markit forecast.
Little Rock Metropolitan Nonfarm Employment

Louisville Metropolitan Nonfarm Employment

Memphis Metropolitan Nonfarm Employment

St. Louis Metropolitan Nonfarm Employment

SOURCES FOR THE FOUR FIGURES: IHS Markit and Haver Analytics, with projections based on the author’s calculations. The St. Louis figure uses IHS forecasts from the second quarter of 2021.
NOTE FOR THE FOUR FIGURES: The pre-pandemic level is the first quarter of 2020.
Putting this all together, the takeaway is that IHS Markit forecasts that the rate of job growth will remain close to 2021 levels for several quarters before returning to pre-pandemic levels by the forecast horizon. This aligns with statements from District and national Fed leaders that the economy still has a ways to go before returning to pre-pandemic employment levels; the continued strong job growth projected into mid-2022 reflects the anticipated economic expansion.
In the long run, however, employment growth is projected to slow from the 2021 pace in part because the fundamentals of the District’s labor market are not markedly changed from prior to the pandemic. The District’s population growth rates point to slower long-term output and employment growth rates, and the pandemic has not affected those longer-term trends.
Regional Differences
While the general picture is the same for all four MSAs, there are some important differences among regions. Of the four metro areas, Memphis saw employment drop by the smallest amount and is projected to return to pre-pandemic employment levels in second quarter of 2022, the fastest of the four MSAs. However, this is based on survey data that will be revised in March 2022 and source data for the first half of 2021 indicated job growth in the Memphis MSA was slower than survey data indicated.All projections in this piece are based on the Current Employment Statistics data from the Bureau of Labor Statistics, which are pulled from a survey of state firms. These figures are later revised based on the Quarterly Census of Employment and Wages (QCEW), which draws from establishment reports to unemployment insurance programs. Projecting out QCEW growth rates gives the Memphis MSA an adjusted growth rate of 0.2% in 2021. With these revised numbers, it would take Memphis until 2025 to return to pre-pandemic employment numbers.
Future Risks
There are general risks in both directions for these projections. The downside risks reflect continuations of current trends: Sluggish labor force participation rates could hamper firms’ attempts to hire, leading to persistently lower employment. Sectoral factors could also play a part. The employment recovery has been concentrated in industries that saw significant pandemic declines in 2020, such as restaurants. With this “rebound” growth completed, going forward, employment will need to come from expanded business activity—a tougher task.
Yet there is also an easily understandable case for how jobs could return faster than IHS Markit’s historical model would suggest. A historically tight labor market could put continued pressure on employers to raise wages, bringing new workers off the sidelines at faster-than-anticipated paces and maintaining 2021 growth levels into the coming year.
Notes and References
- Headquartered in St. Louis, the Eighth Federal Reserve District includes all of Arkansas, southern Illinois, southern Indiana, western Kentucky, northern Mississippi, eastern Missouri and western Tennessee.
- IHS Markit forecast is model-based using historical data and does not incorporate information from new business developments.
- All projections in this piece are based on the Current Employment Statistics data from the Bureau of Labor Statistics, which are pulled from a survey of state firms. These figures are later revised based on the Quarterly Census of Employment and Wages (QCEW), which draws from establishment reports to unemployment insurance programs. Projecting out QCEW growth rates gives the Memphis MSA an adjusted growth rate of 0.2% in 2021. With these revised numbers, it would take Memphis until 2025 to return to pre-pandemic employment numbers.
Citation
Nathan Jefferson, ldquoHow Fast Will Regional Employment Return?,rdquo St. Louis Fed On the Economy, Jan. 11, 2022.
This blog offers commentary, analysis and data from our economists and experts. Views expressed are not necessarily those of the St. Louis Fed or Federal Reserve System.
Email Us
All other blog-related questions


