


The Relationship between Consumption Growth and Inflation
One of the simplest ways to think about the relationship between inflation and monetary policy is the following: A tight monetary policy reduces consumption and investment growth by tightening financial conditions. In turn, this lowered demand reduces inflation through the price-setting decisions of firms.This logic is close to the description of the Phillips curve in this working paper (PDF).
This blog post analyzes consumption growth and inflation data with this simple logic in mind. There are two main questions:
- Has inflation since April 2021 been correlated with a rapid increase in consumption growth?
- Is the tightening in monetary policy working through the mechanism described earlier?
The evidence in this post suggests the answer to the first question is no and the answer to the second question is possibly.
The analysis presented here focuses on the relationship between consumption and inflation since the early 2000s. The primary variable of interest is the annualized growth rate for monthly growth in seasonally adjusted real personal consumption expenditures (PCE). The first figure shows the distribution of this variable classified into two groups: the period that marked the first 13 months of the COVID-19 pandemic (March 2020 through March 2021) and all other months since January 2002.
Distribution of Monthly Changes in Real Consumption
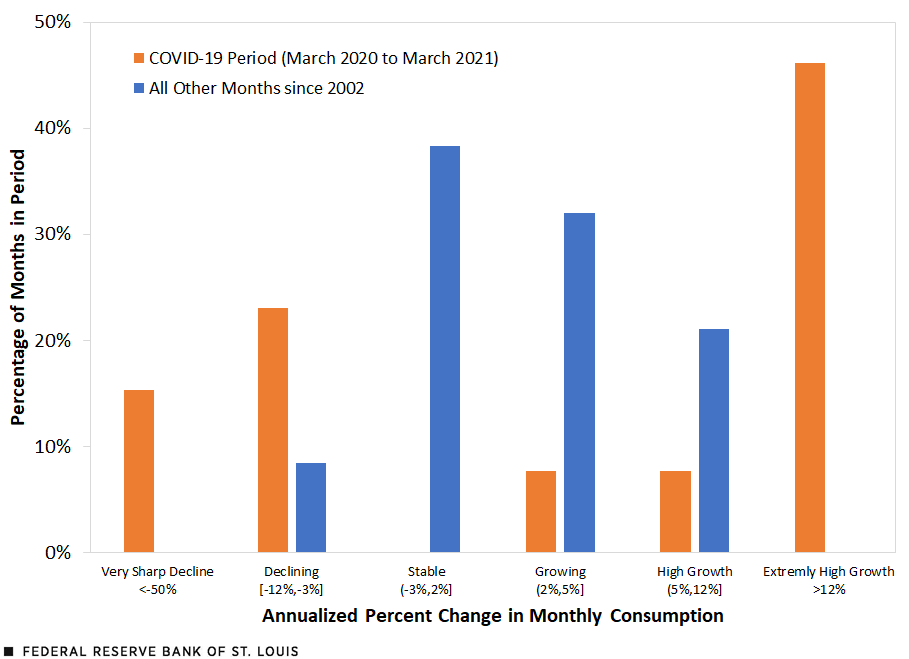
SOURCES: Bureau of Economic Analysis and author’s calculations.
NOTE: Data are seasonally adjusted. “All other months” is the period from January 2002 to November 2022, excluding the COVID-19 months from March 2020 to March 2021.
The blue bars depict the distribution of results for “all other months.” In most of the months (about 70%), real consumption was either stable (growth rate between -3% and 2%) or growing (growth rate between 2% and 5%). There is a significant share of periods (21%) of high growth in real consumption (between 5% to 12%) and only a small share of the months (9%) with a significant decline in real consumption (between -12% and -3%).
The orange bars show that the distribution of real consumption growth was very different during the COVID-19 months from March 2020 to March 2021. Notice that consumption was never in the stable range during these 13 months. During the first two months, real consumption declined at a record pace: an annual rate of -78% and -55%. The recovery was also speedy, with six months of growth rates that were higher than 15%.
Since consumption changes during these pandemic months were very extreme compared with the other months since 2002, we exclude them from the rest of the analysis. Now we compare real consumption changes with inflation for selected subperiods. For inflation, we consider the annualized and seasonally adjusted monthly changes in the chain-type price index of personal consumption expenditures. (See the figure below.)
Correlation of Changes in Real Consumption and Inflation: Selected Periods
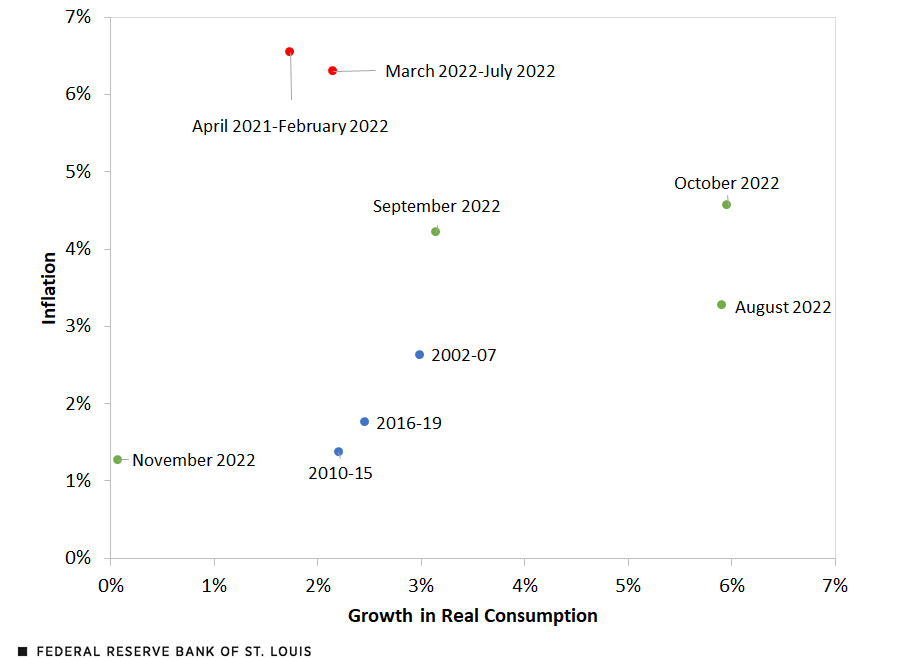
SOURCES: Bureau of Economic Analysis and author’s calculations.
The blue dots in the second figure show three “normal” subperiods, in which inflation was between 1% to 3% and real consumption growth was about 2% to 3%. There is also a positive relationship between consumption growth and inflation, in line with the logic described initially.
The red dots show two high inflation subperiods, from April 2021 to February 2022 and from March to July 2022. Although inflation was very high (about 6%) in both periods, consumption growth was average. This suggests the high inflation was because of something other than growing demand. In that case, inflation during these periods may be associated with supply disruptions, or other components of demand (e.g., government consumption), rather than high real consumption growth.
Since March 2022, the Federal Reserve has raised interest rates, so the second period highlighted in red also corresponds to a period of tightening monetary policy. During March to July 2022, inflation continued at 6%, and consumption growth was slightly higher than in the previous months. This pattern suggests that monetary policy, at least during those months, didn’t yet reduce consumption growth, as mentioned at the beginning of this post.
The last four months, August through November, are depicted with green dots in the second figure. Two patterns are clear. First, inflation is significantly lower in the four months and is now close to 1%. Second, real consumption growth was very high during August and October but has finally decreased to an annual rate of just over 0% in November. Thus, only the data corresponding to November suggest that the monetary mechanism described above may be working.
Note
- This logic is close to the description of the Phillips curve in this working paper (PDF).

Citation
Juan M. Sánchez, ldquoThe Relationship between Consumption Growth and Inflation,rdquo St. Louis Fed On the Economy, Dec. 29, 2022.
This blog offers commentary, analysis and data from our economists and experts. Views expressed are not necessarily those of the St. Louis Fed or Federal Reserve System.
Email Us
All other blog-related questions