


Economic Effects of Fed Tightening Episodes since the 1980s: Part II
On March 16, the Federal Open Market Committee (FOMC) voted to raise its federal funds target rate (FFTR) range by 25 basis points. As noted in the first of this two-part blog series, this increase—and, importantly, the expectation of further increases reported in the March Summary of Economic Projections—indicates that the seventh episode of monetary policy tightening since the early 1980s is underway. The second part of this series will examine the behavior of key interest rate-sensitive economic variables during the past six tightening episodes.This blog post is based in part on research by the author for an article titled “A Comparison of Fed ‘Tightening’ Episodes since the 1980s” that will appear in a forthcoming issue of the International Journal of Central Banking.
The Federal Reserve’s main forecasting model presumes that raising the FFTR rate will raise other key interest rates, such as those on mortgages, auto loans or credit cards. Conventional economic theory holds that Fed tightening reduces the growth of demand for goods and services purchased by households through several channels of influence, such as expenditures on interest-sensitive goods. In turn, changes in the demand for goods and services generally affect production and employment. Economic textbooks generally assert that business capital spending (fixed investment) is sensitive to changes in interest rates. However, the empirical evidence is less supportive of this view.See Steve A. Sharpe and Gustavo A. Suarez’s 2014 Finance and Economics Discussion Series working paper “Why Isn’t Investment More Sensitive to Interest Rates: Evidence from Surveys (PDF)” for a recent assessment.
This blog post will examine trends in three key economic series before and after the six previous Fed tightening episodes since the early 1980s. Such an exercise may provide a possible roadmap for how key elements of the economy will evolve during the present episode. The three series are:
- Real consumer expenditures on durable goods
- Real residential fixed investment
- Civilian unemployment rate
Each of the three figures below have the following characteristics:
- A vertical dotted line will denote the quarter when the FOMC began each of the six tightening episodes (liftoff).See the first part of this On the Economy blog series, “A Look at Fed Tightening Episodes since the 1980s: Part I,” for the specific dates of the initial tightening action in each episode.
- The timeline begins four quarters before liftoff and ends eight quarters after liftoff.
- The solid black line represents the growth rates (for real consumer expenditures on durable goods and real residential fixed investment) or average level (for civilian unemployment rate) at each of the quarterly horizons before liftoff, at the time of liftoff, and one to eight quarters after liftoff.
- The shaded area shows the range of outcomes for each series (highest to lowest).
The Impact on Consumer Spending on Durable Goods
The first figure shows the four-quarter growth of real personal consumption expenditures on durable goods, like automobiles, appliances or furniture. In the year before liftoff (T-4 to T), growth of expenditures on durable goods increased, on average, from just under 6% to slightly less than 10%. Growth of durable goods expenditures remained roughly unchanged (on average) during the first three quarters of Fed tightening, but then growth decelerated—while remaining positive—two years after liftoff. As you can see in the shaded region, there was a lot of variability after liftoff—from a maximum growth of about 21% one year after liftoff to a minimum of zero growth seven quarters after liftoff.
Fed Tightening and Real Personal Consumption Expenditures in Durable Goods
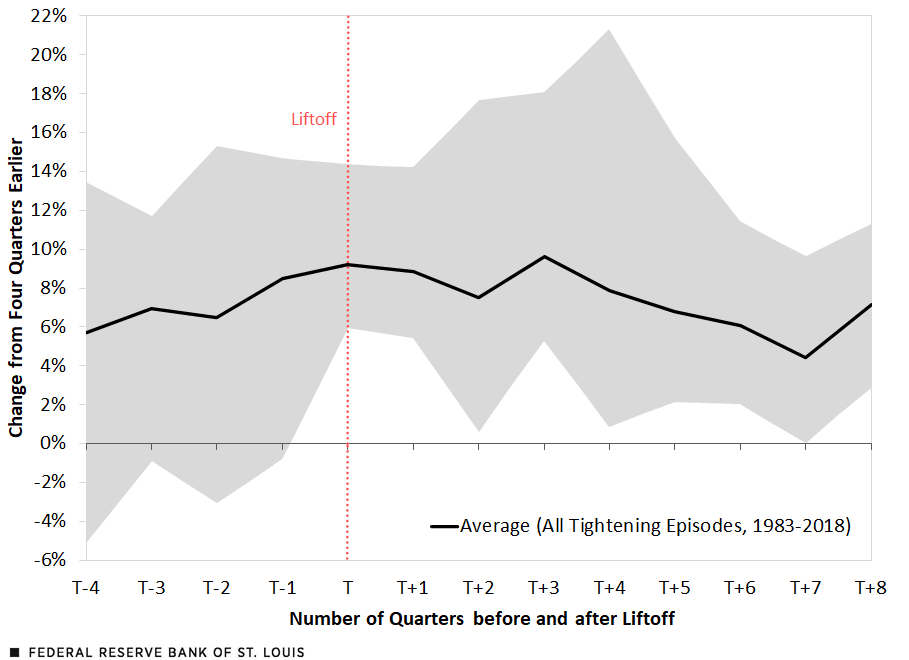
SOURCES: Bureau of Economic Analysis, Haver Analytics and author’s calculations.
The Impact on New Housing Investment
The second figure shows real residential fixed investment (RFI), which includes new single- and multifamily construction and remodeling. The figure shows that RFI appears to be much more sensitive to FFTR increases than consumer spending on durable goods. Real RFI growth was strengthening in the year before liftoff and continued to strengthen for two quarters after liftoff. Thereafter, growth of RFI decelerated sharply, approaching zero* in the seventh and eighth quarters after liftoff. Interestingly, as the shaded region shows, the range of outcomes was quite large in the first four or five quarters after liftoff but then narrowed sharply thereafter.
Fed Tightening and U.S. Real Residential Fixed Investment
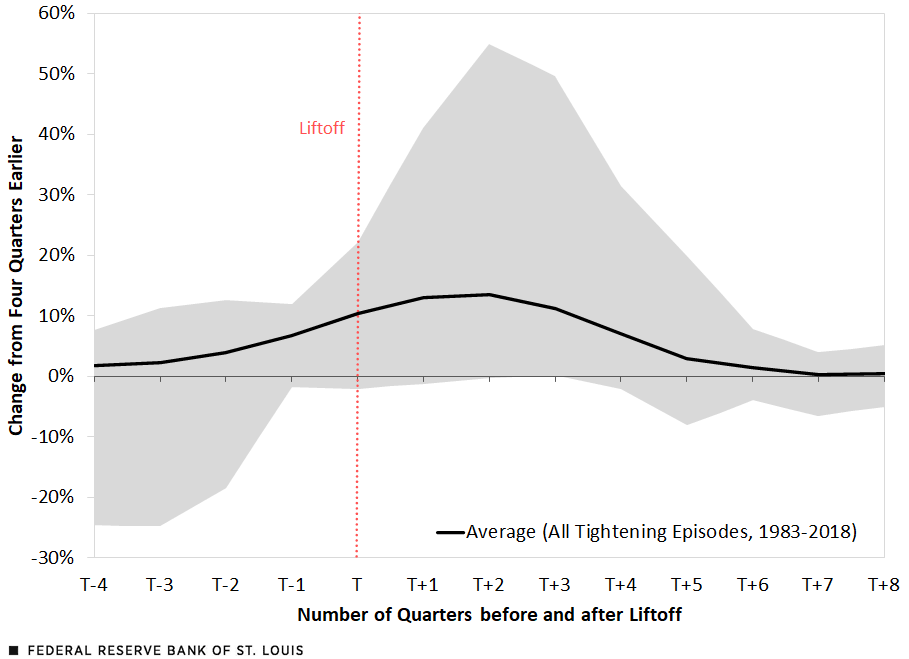
SOURCES: Bureau of Economic Analysis, Haver Analytics and author’s calculations.
The Impact on Unemployment
The third figure shows the civilian unemployment rate. Similar to the previous two figures, the unemployment rate was falling prior to liftoff, which is indicative of a strengthening economy. The unemployment rate continued to decline, on average, until about six quarters after liftoff, then stabilized thereafter. Two years after liftoff, the unemployment rate across the six episodes of Fed tightening averaged 5.2%, about 1 percentage point less than its average during those episodes’ liftoff quarter.
Fed Tightening and U.S. Civilian Unemployment Rate
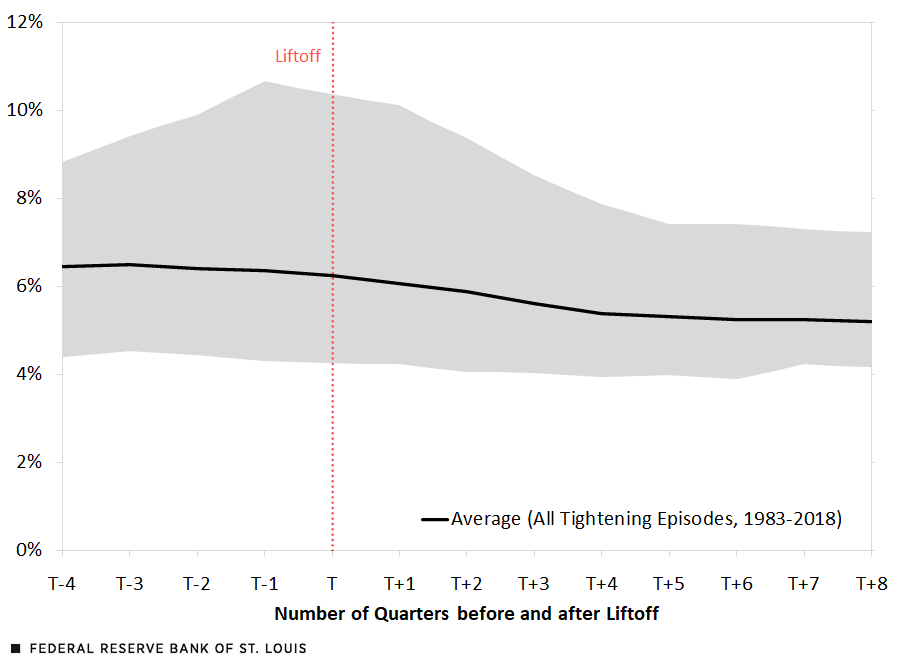
SOURCES: Bureau of Economic Analysis, Haver Analytics and author’s calculations.
Key Takeaways
In a typical tightening episode, the Fed raises its FFTR in response to a strengthening economy with rising price pressures. During tightening episodes, housing (real RFI) appears to be more sensitive to rising interest rates than real expenditures on consumer durable goods. Labor market conditions, using the unemployment rate as a proxy, remained strong in the two years following liftoff.
The author would like to thank Devin Werner, a research associate at the Federal Reserve Bank of St. Louis, for his excellent research assistance.
*Editor's Note: The description of the declining growth of RFI was revised, and the second figure showing RFI was updated to correct the number of episodes used to calculate the graphical results.
Notes and References
- This blog post is based in part on research by the author for an article titled “A Comparison of Fed ‘Tightening’ Episodes since the 1980s” that will appear in a forthcoming issue of the International Journal of Central Banking.
- See Steve A. Sharpe and Gustavo A. Suarez’s 2014 Finance and Economics Discussion Series working paper “Why Isn’t Investment More Sensitive to Interest Rates: Evidence from Surveys (PDF)” for a recent assessment.
- See the first part of this On the Economy blog series, “A Look at Fed Tightening Episodes since the 1980s: Part I,” for the specific dates of the initial tightening action in each episode.

Citation
Kevin L. Kliesen, ldquoEconomic Effects of Fed Tightening Episodes since the 1980s: Part II,rdquo St. Louis Fed On the Economy, April 18, 2022.
This blog offers commentary, analysis and data from our economists and experts. Views expressed are not necessarily those of the St. Louis Fed or Federal Reserve System.
Email Us
All other blog-related questions