


The Evolution of Household Net Worth during COVID-19
The deep economic crisis that resulted from the onset of the COVID-19 pandemic has had a lasting negative effect on many sectors of the economy. However, while the U.S. economy experienced a historic contraction and record unemployment rates, asset returns were relatively high during 2020 and 2021.
The figure below plots real returns for different classes of assets, showing high real cumulative returns from the end of 2019 to mid-2021. By July 2021, the cumulative return on the S&P 500, a well-known stock market index, exceeded 30%. The real return on a national house price index was 18%, and returns on a corporate bond index were around 5%. Only government bonds underperformed, as their nominal returns were not enough to overcome inflation during the same period.
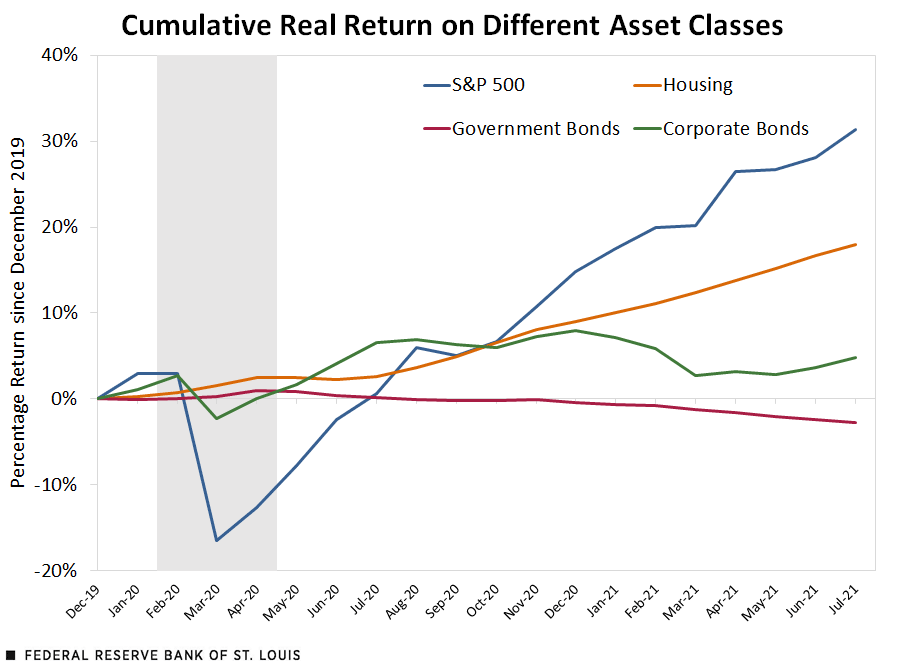
SOURCES: FRED, Haver Analytics and authors’ calculations.
NOTES: The house price index is the S&P/Case-Shiller U.S. National Home Price Index, the return on government bonds is the constant maturity 10-year Treasury yield, and the return on corporate bonds is based on the ICE BofA U.S. Corporate Index. Shading represents a recession.
Wealth and the Age of Households
In this blog post, we study how these asset returns have affected the net worth of U.S. households in different age groups during 2020 and 2021, where the age is based on the head of the household. Typically, the balance sheet composition of a household will depend on the stage of their lives. Younger households tend to own a house and a mortgage, meaning that they are mostly exposed to real estate and their net worth (the difference between their assets and their liabilities) tends to be small.
As people age and pay off their debts, their net worth rises, and they also tend to diversify the type of assets to which they are exposed. To study the evolution of net worth for different age cohorts, we combined data from the Survey of Consumer Finances (SCF)—which gave us a snapshot of the balance sheet composition for a representative sample of U.S. households—with data on realized returns for different asset classes, as shown in the figure above.
Our starting point was the 2019 SCF: The figure below describes the average balance sheet of a household in each of the age cohorts we considered. As expected, older people tended to be wealthier on average, with more assets and less debt. The age cohort with the most debt on average was the 35-44 group, which likely reflects mortgage debt. The youngest cohort tended to be predominantly exposed to real estate, and the asset composition became more diversified as households aged. For the 65-74 age cohort, the exposure to stocks was almost as large as that of real estate. Exposure to other asset classes was also important, and a significant component of this “other” category was ownership in private businesses.

SOURCES: Survey of Consumer Finances 2019 and authors’ calculations.
Estimating Balance Sheet Performance during the Pandemic
We then took the balance sheet composition across age cohorts that we showed in the previous figure and imputed the returns on each asset class to the portfolios of each household in our sample. This allowed us to compute an estimated monthly change in real net worth between 2019, when the SCF data were collected, and July 2021, when our time series for real returns per asset class ended.
This is plotted in the graph below. Overall, most age cohorts posted significant real returns on their net worth, ranging from 14.2% for the 55-64 age cohort to 25.8% for the youngest cohort, those younger than 35. The reason younger cohorts experienced such high percentage returns was because they tended to be extremely leveraged, meaning their liabilities were a larger percentage of their assets (and so their starting net worth was very low).
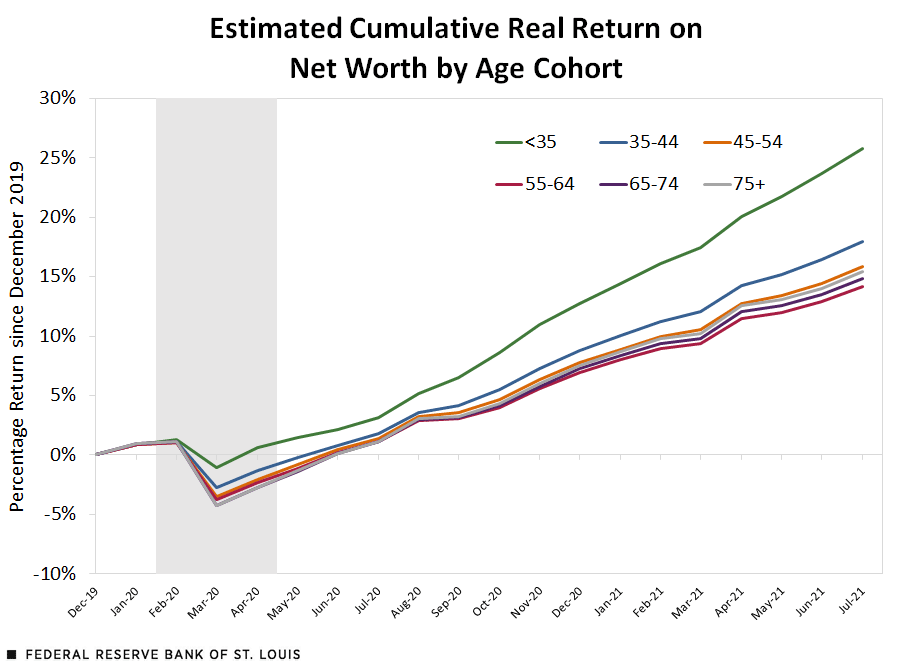
SOURCES: Survey of Consumer Finances 2019 and authors’ calculations.
NOTE: Shading represents a recession.
Relative vs. Absolute Returns
While the relative return was larger for younger cohorts because they were more leveraged, the estimated average dollar return was larger for the older cohorts, since they had more assets and less debt, as seen in the figure below.
By July 2021, households belonging to the 65-74 age cohort experienced an average return of $180,500, the greatest among all cohorts. They were followed closely by households between ages 55 and 64 with $167,000, and households 75 and older with $148,100. In comparison, the youngest cohort (comprised of households younger than age 35) averaged only $19,700, which is a relatively low amount even compared with the next cohort of households between 35 and 44, who averaged $78,600.
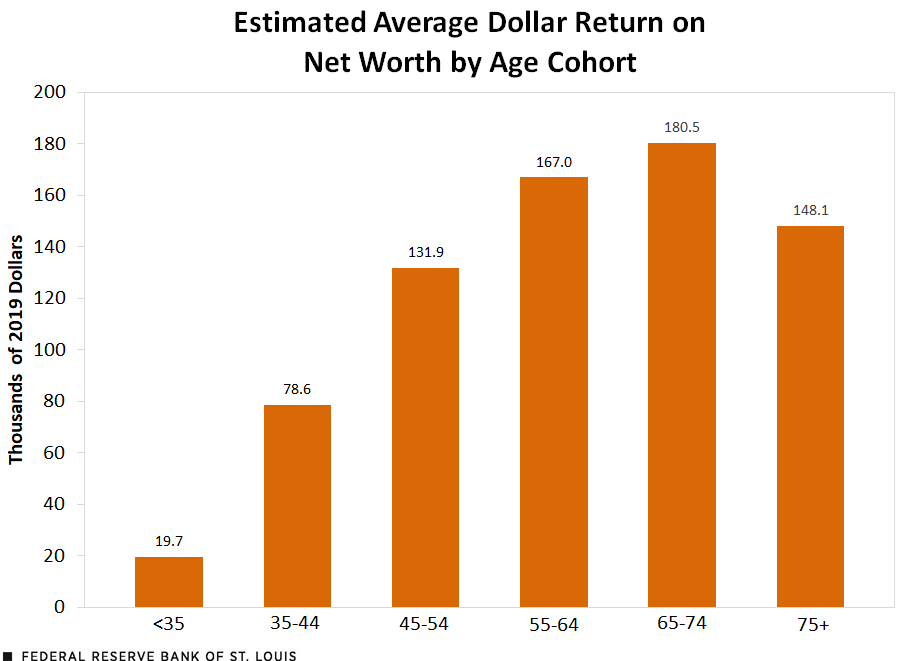
SOURCES: Survey of Consumer Finances 2019 and authors’ calculations.
Disparities in Rebounding Wealth
Compared with the aftermath of previous recessions, returns on assets have not only recovered relatively fast, but also grown significantly. This growth has had a positive effect on the wealth of households across the country, but its effect has differed among age cohorts. On average, older cohorts, particularly for ages 65-74, have enjoyed greater returns because of a greater amount of accumulated assets, while younger households who are starting their asset accumulation have experienced smaller average dollar returns in net worth.
There are several things that we are not taking into account in this analysis, namely the fact that there is significant heterogeneity in balance sheet composition and net worth within each age cohort. The distribution of net worth tends to be significantly right-skewed (i.e., it has a heavy right tail), which means that these average returns may primarily reflect the positions and gains of some very few but very wealthy households.


Citation
Miguel Faria-e-Castro and Ramon Silvera Zumaran, ldquoThe Evolution of Household Net Worth during COVID-19,rdquo St. Louis Fed On the Economy, Nov. 18, 2021.
This blog offers commentary, analysis and data from our economists and experts. Views expressed are not necessarily those of the St. Louis Fed or Federal Reserve System.
Email Us
All other blog-related questions