


What Are Americans Consuming More Of?
U.S. households consume a wide variety of goods and services, everything from heating to housing to health care. The amount consumers spend changes over time. Reasons include:
- Inflation, or the fact that prices are generally rising
- U.S. economic growth, which provides consumers with increased disposable income
Over time, consumers generally increase their spending, but does that mean they are actually consuming more goods and services? In this post, we use personal consumption expenditures (PCE) data from the Bureau of Economic Analysis (BEA) to examine how real consumption of different goods and services has changed from 2002 to 2018.
Breaking Down Growth Rates
The real consumption growth rate is determined by calculating the percent change in real expenditures per capita. We started with total U.S. consumption expenditures for each category provided by the BEA, divided by the U.S. population in the corresponding year, converted those values from nominal to real using the PCE price index for the corresponding expenditure category in the corresponding year, and finally calculated the percent change in the values from 2002 to 2018.
Major Expenditure Categories
The figure below shows real consumption growth rates for overall personal consumption expenditures and the major expenditure categories. Recall that these growth rates are in real terms, meaning that inflation has already been accounted for.
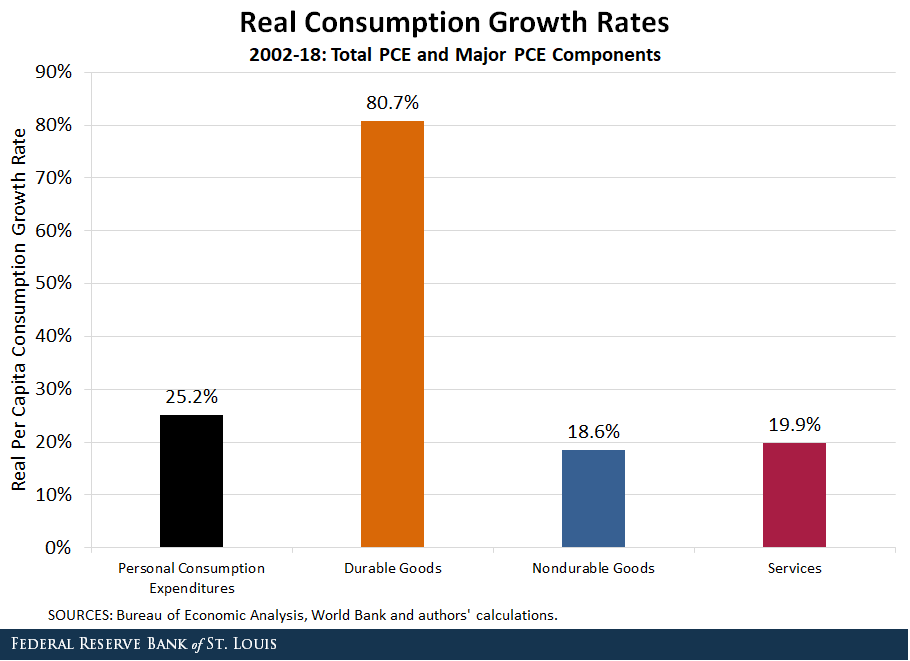
Overall, average consumers spent 25.2% more in 2018 than they did in 2002. We see a substantial difference between the real consumption growth for durable goods (80.7%) and both nondurable goods (18.6%) and services (19.9%).
These numbers tell us that average consumers increased consumption across the board over the sample period and spent significantly more on durable goods in 2018 than they did in 2002.
Spending Subcategories
The next figure shows the real consumption growth rates for select subcomponents of the categories in the previous figure.
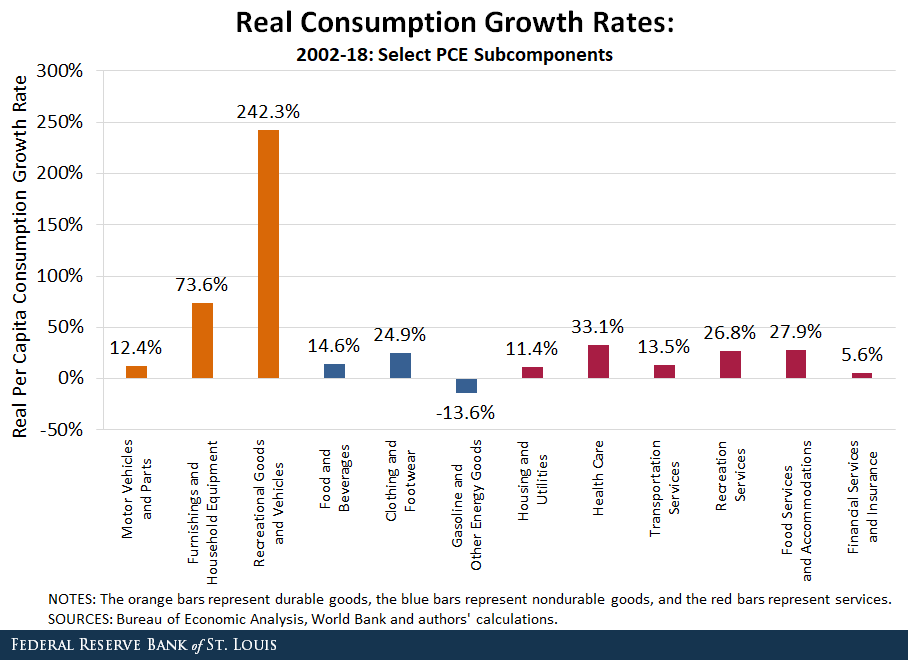
We observe that consumer expenditures grew the most for recreational goods and vehicles (242.3%) and furnishings and household equipment (73.6%). Regarding growth within the nondurable goods and services categories:
- Nondurable goods: Clothing and footwear expenditures grew the most (24.9%).
- Services: Health care expenditures grew the most (33.1%).
The only expenditure category that declined over the sample period was gasoline and other energy goods (-13.6%).
Overall, these numbers demonstrate that the average U.S. consumer enjoyed a higher amount of consumption in 2018 compared to 2002 and that consumers have increased their consumption of different goods and services by varying rates.
It’s important to note that this analysis focuses only on the average U.S. consumer and does not consider the issue of income inequality. It is well documented that the benefits of economic growth have been distributed unevenly across the population during our sample period. Hence, relatively lower income households may not have experienced such gains in real consumption and may disproportionately suffer from the rapidly growing costs of some services, such as housing and health care.
Additional Resources
- On the Economy: The Connection between House Prices and Consumption
- Economic Synopses: Decomposing the Low PCE Inflation Rate


Citation
YiLi Chien and Julie Bennett, ldquoWhat Are Americans Consuming More Of?,rdquo St. Louis Fed On the Economy, March 5, 2020.
This blog offers commentary, analysis and data from our economists and experts. Views expressed are not necessarily those of the St. Louis Fed or Federal Reserve System.
Email Us
All other blog-related questions