


How Well Do Yield Curve Inversion Models Predict Recessions in Other Countries?

A yield curve inversion occurs when the yield on longer-term securities is lower than shorter-term securities. Historically, it has proven useful for predicting recessions in the U.S.
In a previous blog post, we examined the yield curve in Canada, France, Germany, Italy and the U.K to see whether inversion precedes recession in other developed countries. Using a graphical analysis, we determined that yield curve inversion is a good signal for recession in many countries besides the U.S.
In this essay, we estimate a statistical model of recession probability using the yield curve, residential investment and inflation for each of the countries, plus the U.S. This more formal analysis gives a more conclusive picture of how good the yield curve is at predicting recession in these countries.
Yield Curve and Recession Model
Our model for recession probability takes the following form:
Pt = F(α + βYieldCurvet-4 + δCPIt-4 + ρRIt‑4)
- Pt is a binary recession indicator, taking on values of one during a recession and zero otherwise.
- F is the normal cumulative distribution function (more on this below).
- YieldCurvet-4 is yield curve spread, in this case the yield of 10-year government bonds minus the yield of three-month government bonds in a given country.
- CPIt-4 is the quarterly percent change in the consumer price index, an inflation estimator.
- RIt-4 is the quarterly percent change in residential investment.
All of the predictor variables are lagged by four quarters. That is, all the variables on the right side of the equation use values a year behind the values of Pt. We lag the variables because a yield curve inversion today typically would not imply a recession today but rather sometime in the future.
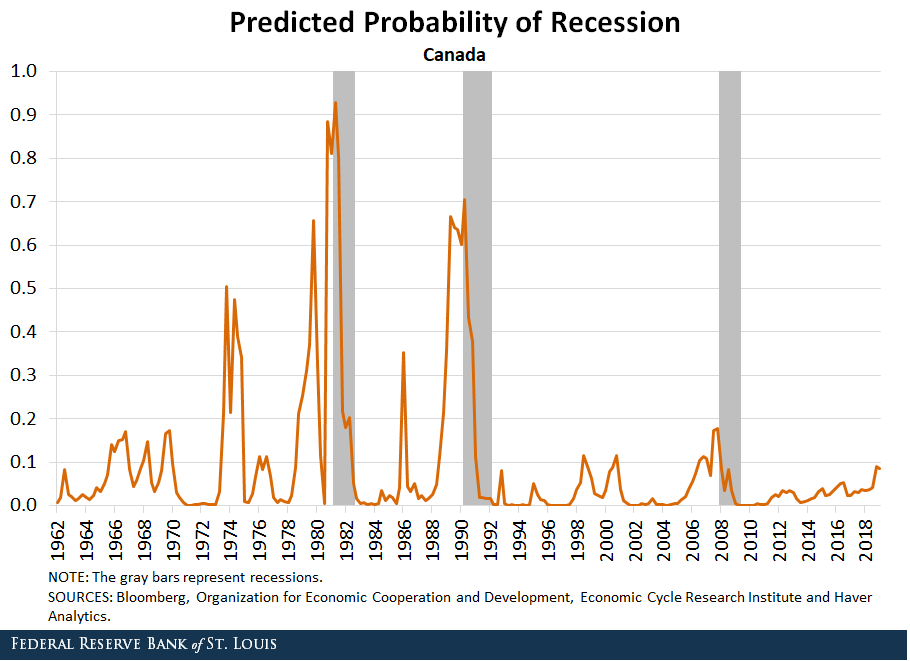
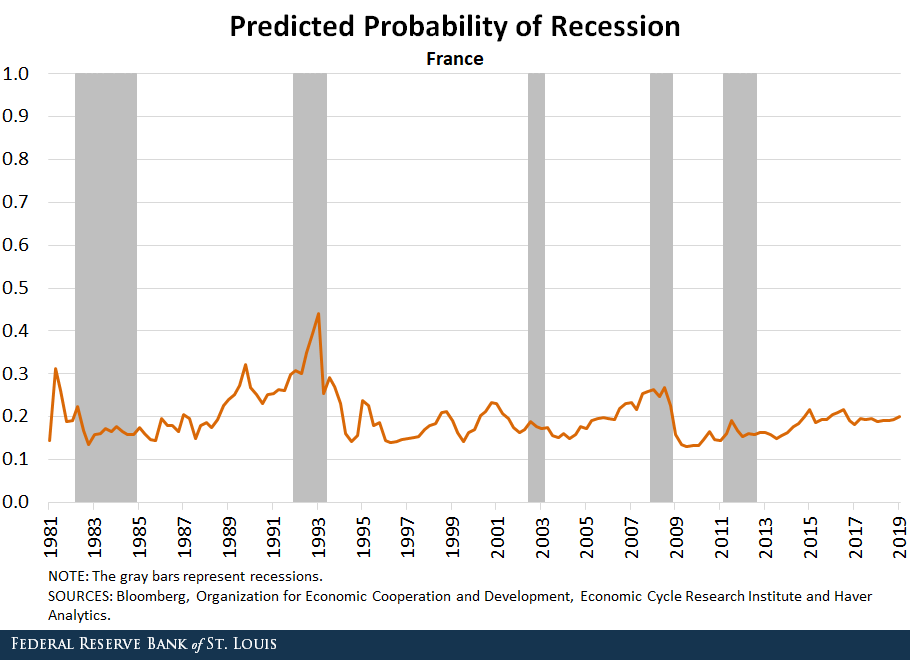
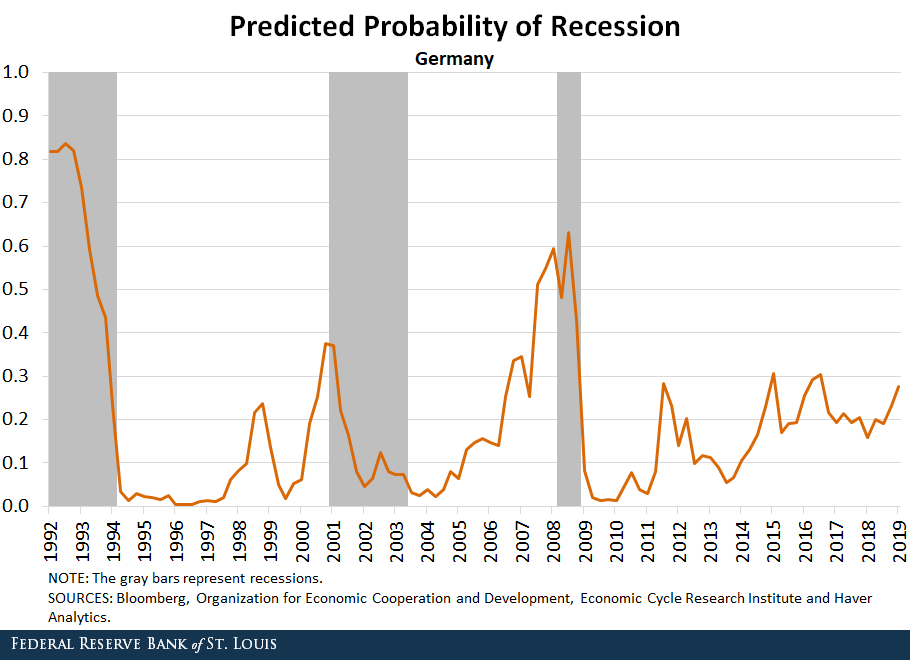
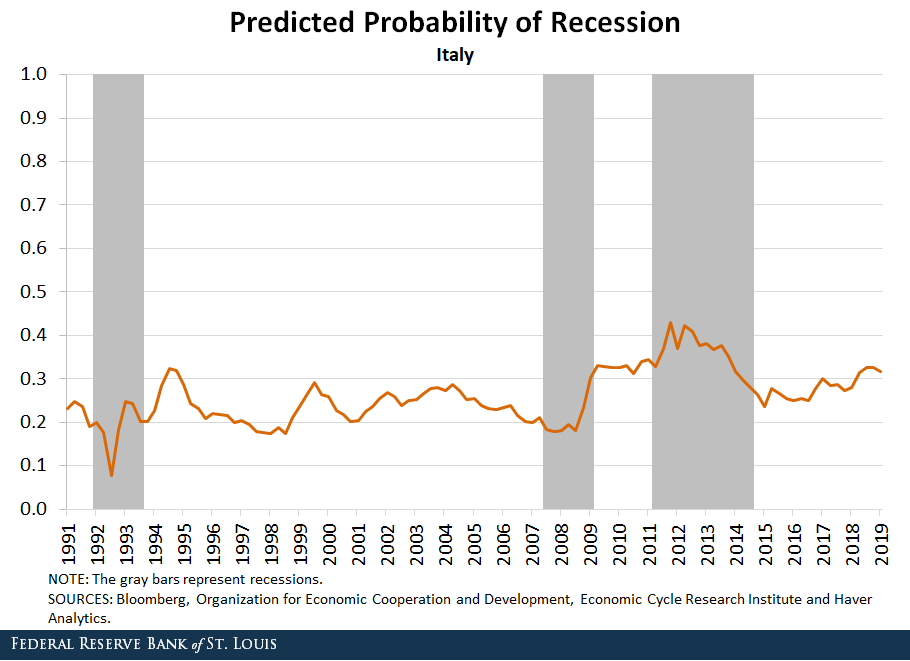
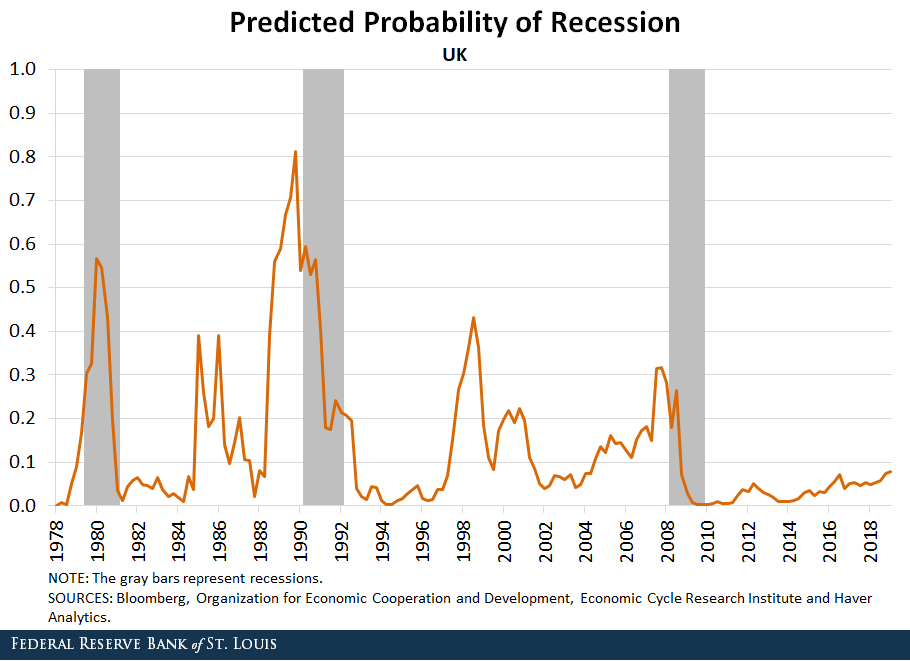
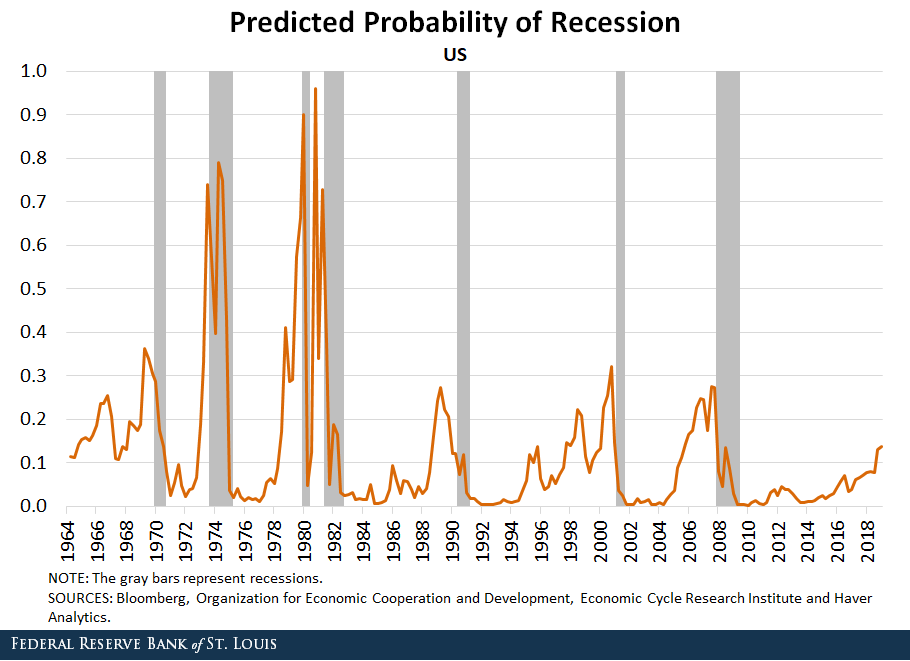
We chose four quarters as a baseline to assess the probability of recession in one year, given a yield curve inversion today. Because the dependent variable in this model is binary (taking on only values of zero or one), we used a probit model which relies on a “link function” (in this case, the normal cumulative distribution function F) to ensure that the predicted values are between zero and one. We ran this regression separately for each of the six countries. The fitted values from the probit regression for each of the six countries are presented in the figures at the end of this post.
Yield Curve Model Results
Looking at the fitted values from the probit models, our model—which uses yield curve spread, change in inflation and change in residential investment to predict recessions—worked best for the U.S. and Germany. Both of these countries saw spikes in recession probability immediately before a recession and have little to no false positives (i.e., spikes in recession probability that don’t precede a recession).
The model seemed useful in Canada, France and the U.K. but gave less consistent signals and included more false positives. For example, recession probability spiked in 1973 in Canada, but the country did not enter into recession for another seven years. The same was true for the U.K., which saw a probability spike in 1997 but did not see a recession until more than a decade later.
In France, the probability was more erratic over the whole time series, with some spikes before a recession and others during or after the start (such as the 2007-09 and 2011-12 recessions), though the magnitude of predicted probability changed little compared to the other countries’ models.
The model worked less well in Italy, where recession probability was low throughout its first and second recessions, though it did rise somewhat before its last recession.
Conclusion
Compared to our last post, these results show more formally that yield curve inversion can be a good predictor of future recessions in most of the countries we’ve examined, especially once we include changes in inflation and residential investment by including them in the model. However, yield curve inversion remains a better predictor in some countries than in others.Additional Resources
- On the Economy: Do Yield Curve Inversions Predict Recessions in Other Countries?
- On the Economy: Predicting Recessions: Which Signals Are More Accurate?
- On the Economy: Can an Inverted Yield Curve Cause a Recession?

Citation
Sungki Hong, ldquoHow Well Do Yield Curve Inversion Models Predict Recessions in Other Countries?,rdquo St. Louis Fed On the Economy, Oct. 7, 2019.
This blog offers commentary, analysis and data from our economists and experts. Views expressed are not necessarily those of the St. Louis Fed or Federal Reserve System.
Email Us
All other blog-related questions