


Key Housing Indicators Weaken Further in 2019

As of late 2018, four housing indicators that had signaled each of the three most recent recessions were on a track consistent with a late 2019 or early 2020 recession. They are:
- 30-year fixed mortgage rates
- Existing home sales
- Real house prices
- Contribution of residential investment to GDP growth
In my December 2018 article, “Recession Signals: Four Housing Indicators to Watch in 2019,” I compared in each case recent levels or rates to a measure of activity that reaches back a few years. This is a simple way to “de-trend” the variables, highlighting cyclical variation around turning points.
How do they look now as we approach mid-year 2019?
How Are Housing Indicators Faring This Year?
All four of the housing indicators highlighted late last year are more concerning now, according to data through the first quarter of 2019.
1. 30-Year Fixed Mortgage Rates
The mortgage rate declined sharply in the first quarter of 2019 from its recent peak in the fourth quarter of 2018 (see the figure below). This follows the pattern seen prior to each of the three most recent recessions, when the mortgage rate reached its cyclical peak between four and seven quarters before the recession began. In other words, the recent decline in the mortgage rate is consistent with a recession beginning in late 2019 or early 2020.
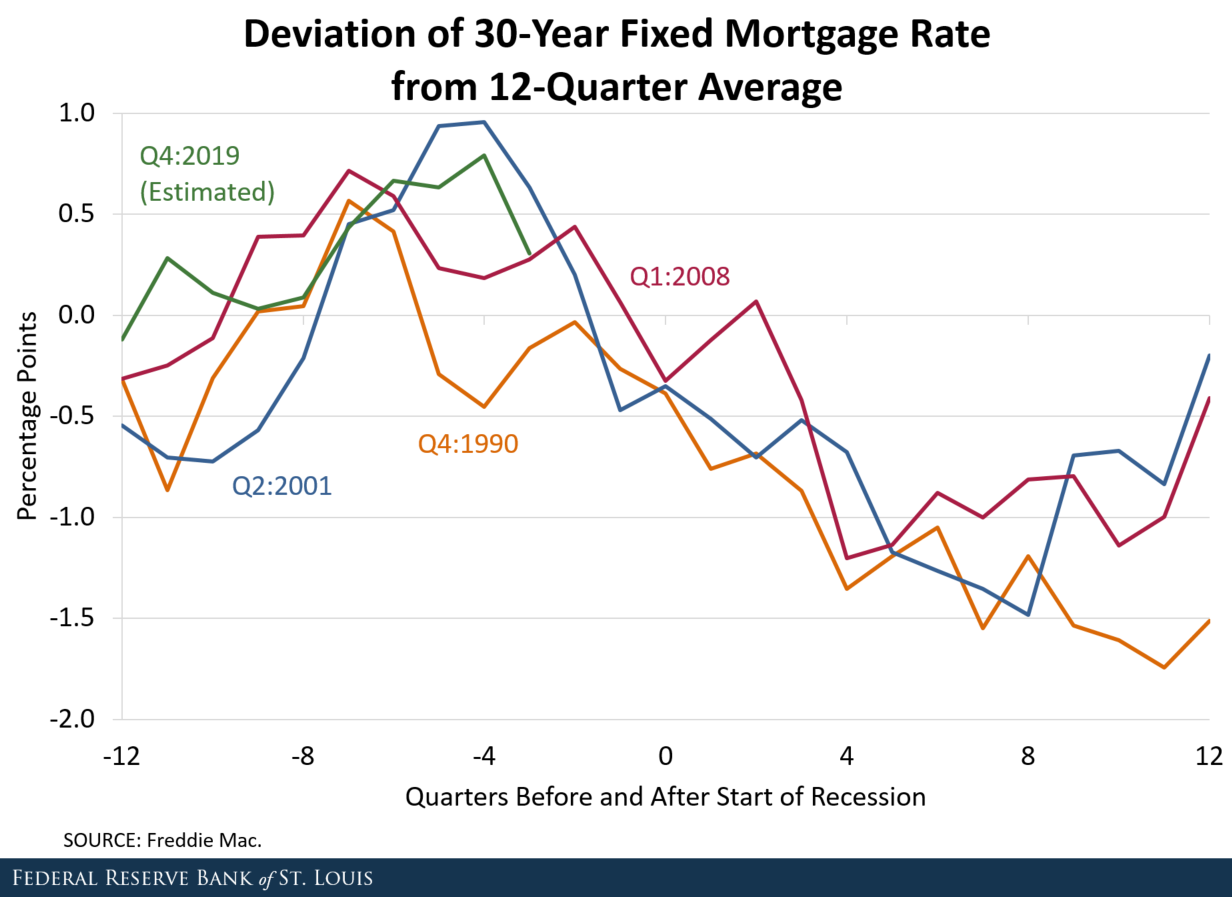
NOTES: The figure shows the average quarterly 30-year fixed mortgage rate minus the average of the previous three years (12 quarters). Each line shows three years of data before and after a recession; time zero is the quarter in which a recession began. The first full quarter of the recession is indicated in the line label (key).
*This line assigns the beginning of the next recession (period zero) to the fourth quarter of 2019; of course, the onset of the next recession is unknown. The last observation in this series (for quarter -3) is for the first quarter of 2019.
SOURCE: Freddie Mac.
2. Existing Home Sales
Compared to the rate at which existing homes were selling in the three-year period ending four quarters earlier, current home sales fell to lower levels in each of the last two quarters (see the figure below). The current weakening trend is consistent with the pattern seen in the run-up to each of the three most recent recessions.
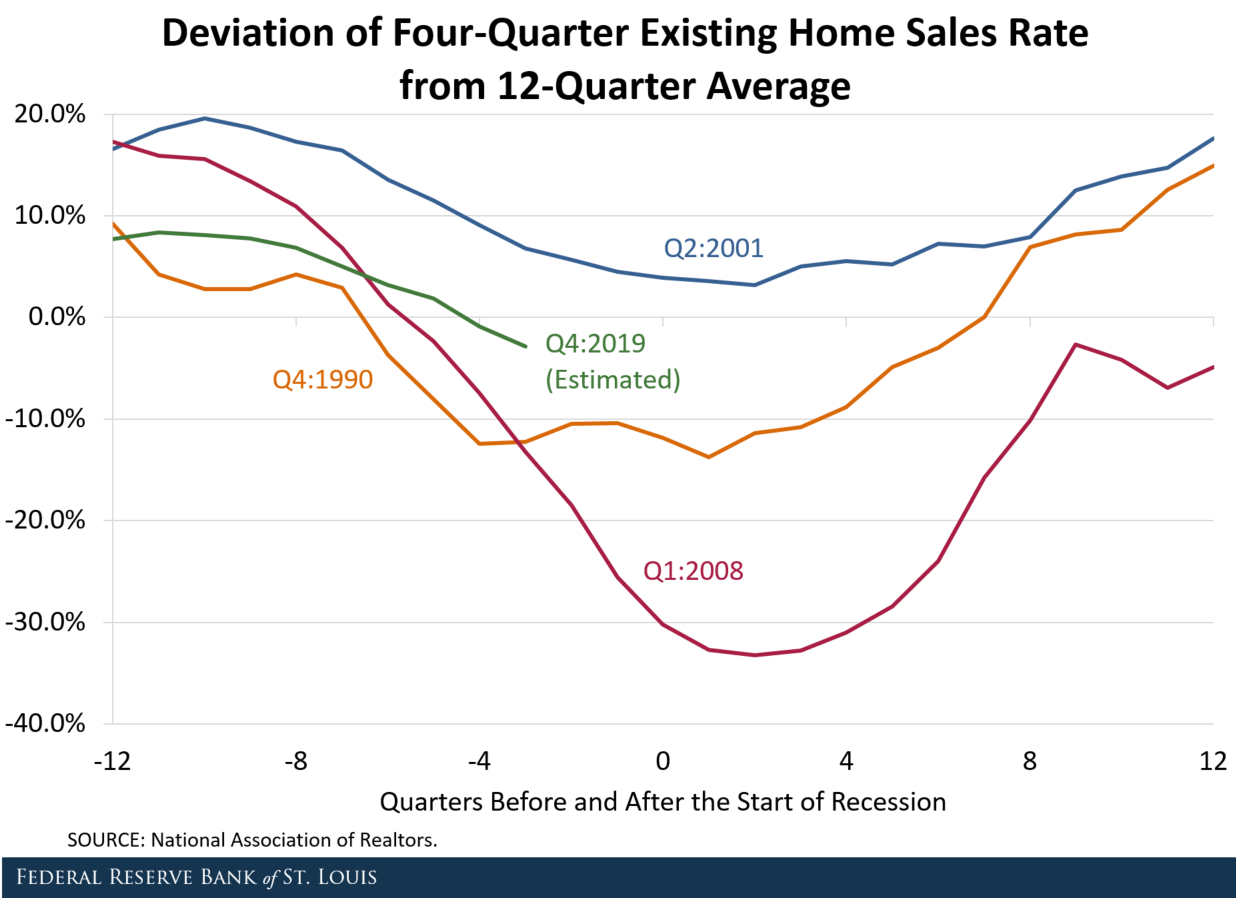
NOTES: The figure shows the percent difference between the current rate of existing single-family home sales (four-quarter average) and the average annualized sales rate during the previous three years (12 quarters). Each line shows three years of data before and after a recession; time zero is the quarter in which a recession began. The first full quarter of the recession is indicated in the line label (key).
*This line assigns the beginning of the next recession (period zero) to the fourth quarter of 2019; of course, the onset of the next recession is unknown. The last observation in this series (for quarter -3) is for the first quarter of 2019.
SOURCE: National Association of Realtors.
3. Real House Prices
Compared to previous business cycles, real home-price changes have been relatively stable recently (see the figure below). Nonetheless, the most recent behavior of home prices is consistent with patterns in earlier cycles. The softening of home prices is much less than in the period before the Great Recession, but it is very similar to the run-up to the recession beginning in 1990.
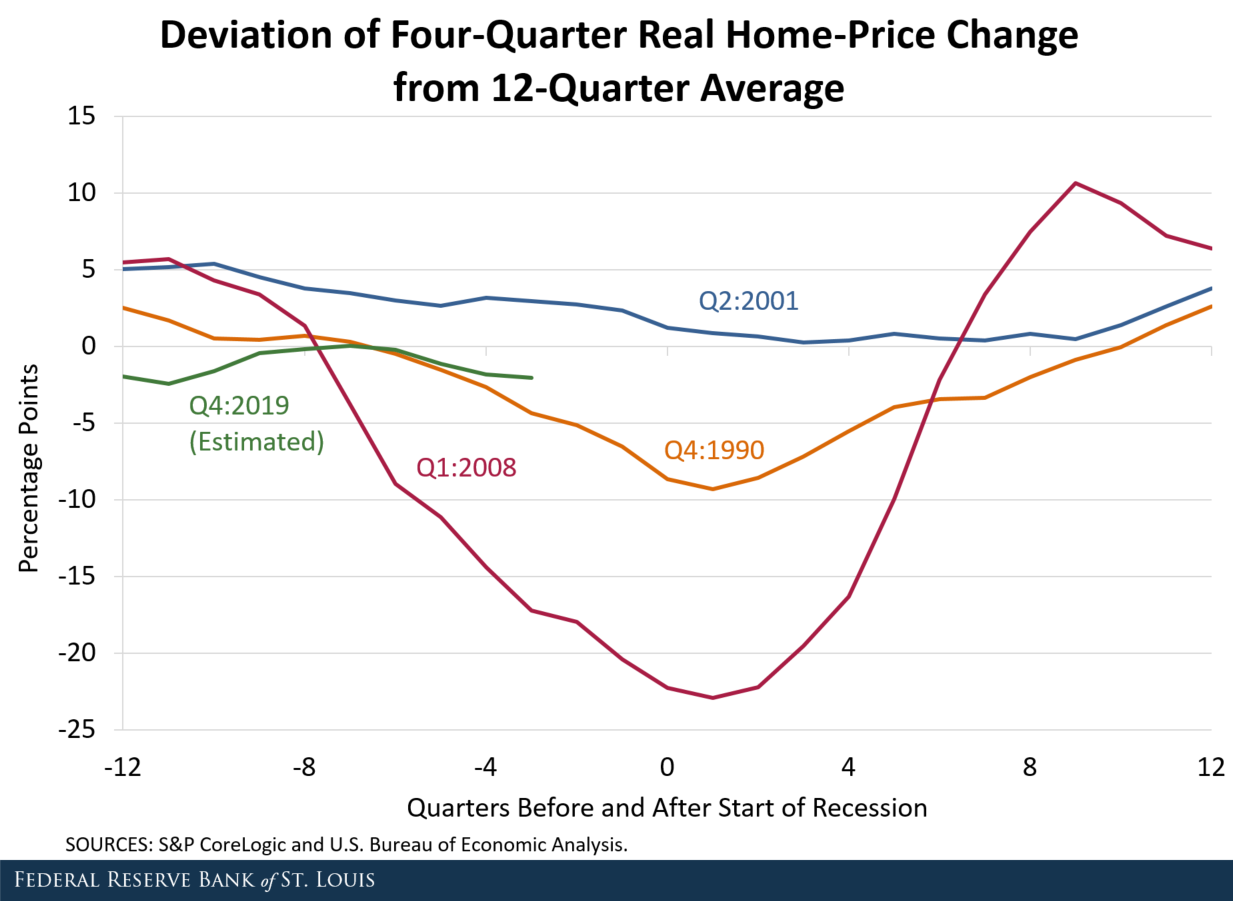
NOTES: The figure shows the four-quarter percent change in the CoreLogic Home Price Index, deflated by the personal consumption expenditures (PCE) chain-weighted price index, minus the annualized percent change during the previous three years (12 quarters). Each line shows three years of data before and after a recession; time zero is the quarter in which a recession began. The first full quarter of the recession is indicated in the line label (key).
*This line assigns the beginning of the next recession (period zero) to the fourth quarter of 2019; of course, the onset of the next recession is unknown. The last observation in this series (for quarter -3) is for the first quarter of 2019.
SOURCES: S&P CoreLogic and U.S. Bureau of Economic Analysis.
4. Contributions of Residential Investment to GDP Growth
Like home prices, the contribution of residential investment to economic growth has been comparatively stable recently (see the figure below). Yet the current cyclical position of residential investment—subtracting modestly from overall economic growth—is very similar to the patterns seen before the 1990-91 and 2001 recessions.
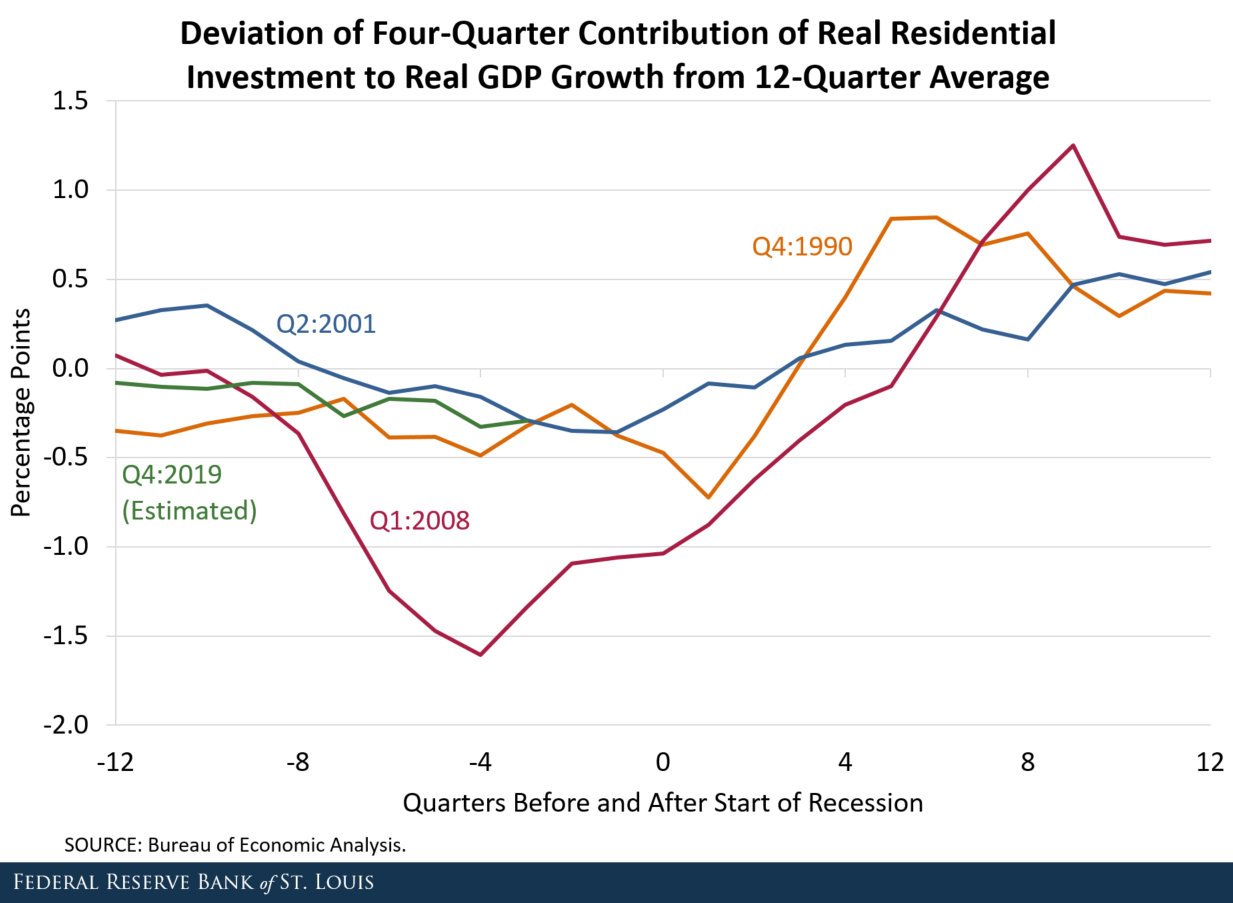
NOTES: The figure shows the four-quarter average contribution to real GDP growth minus the annualized contribution during the previous three years (12 quarters). Each line shows three years of data before and after a recession; time zero is the quarter in which a recession began. The first full quarter of the recession is indicated in the line label (key).
SOURCE: U.S. Bureau of Economic Analysis.
What Might These Four Housing Indicators Be Signaling?
The recession signal provided by several key housing indicators in late 2018 strengthened in early 2019 in the sense that their cyclical behavior is well within the range traced out in the run-up to the three most recent recessions. Combined with movements in other indicators with good forecasting track records (such as the inversion in the slope of the Treasury yield curve), these housing measures suggest an above-average risk of recession within the next few quarters. Of course, the onset of the next recession is unknown.
Additional Resources
- On the Economy: What Real Interest Rates Tell about the Recession to Follow

Citation
William R. Emmons, ldquoKey Housing Indicators Weaken Further in 2019,rdquo St. Louis Fed On the Economy, June 24, 2019.
This blog offers commentary, analysis and data from our economists and experts. Views expressed are not necessarily those of the St. Louis Fed or Federal Reserve System.
Email Us
All other blog-related questions