


Crop Prices and Flooding: Will 2019 Be a Repeat of 1993?
In March, the National Oceanic and Atmospheric Administration (NOAA) announced that nearly two-thirds of the continental U.S. faced an elevated flood risk through May 2019.Spring Outlook: Historic, widespread flooding to continue through May.” National Oceanic and Atmospheric Administration, March 21, 2019. Residents in the Upper Midwest and the Mississippi River Valley continue to face the risk of historic, major flooding. The figure below from the NOAA’s website depicts the risk of minor, moderate and major river flooding for June through August.
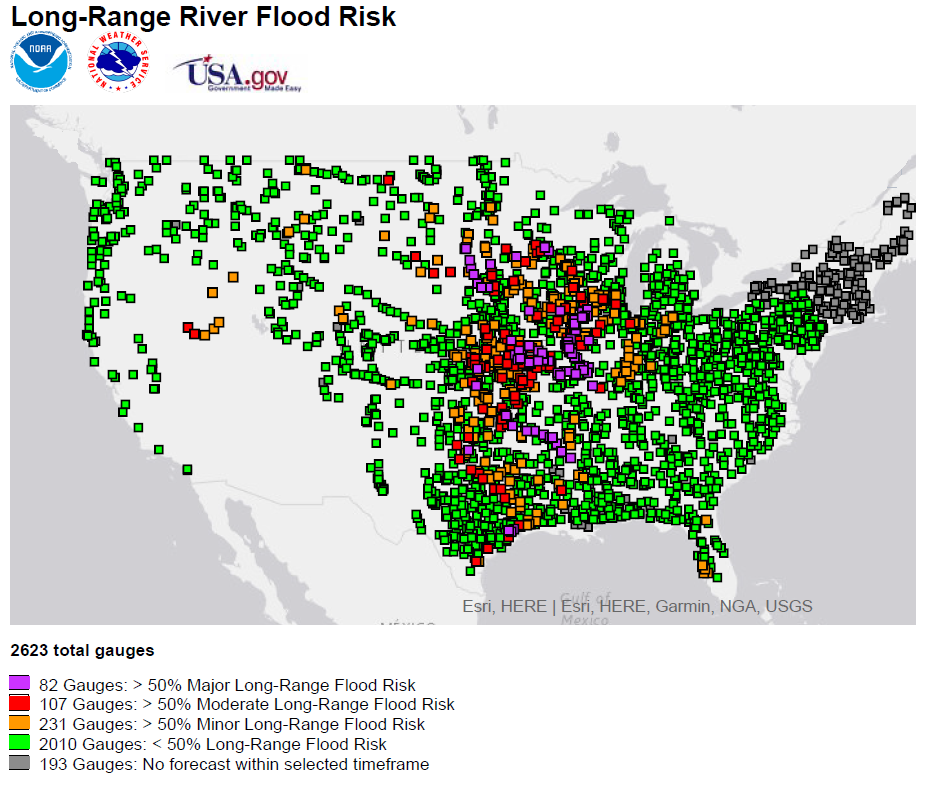
NOAA’s River Forecast Centers observed the Mississippi River at 44 feet, 11 inches at St. Louis on June 5 and forecasts the river to crest at 45 feet, 4 inches on June 6, just below the record 49 feet, 6 inches set in 1993. Anything over 40 feet for the Mississippi River at St. Louis is considered a major flood stage.See NOAA forecasts.
Additional Flooding Concerns
Floods experienced in 2019 pose additional risks as some of the longest floods in history. Further downstream, the Army Corps of Engineers in South Louisiana has already opened the Bonnet Carre Spillway twice this year. The Corps has also prepared to open the Morganza Spillway for only the third time in its history.The Morganza Spillway is scheduled to open today, which was postponed from June 2 as upstream rivers have pushed flood waters down more slowly than expected.
The Mississippi River at Baton Rouge and the Mississippi River at Red River Landing registered their longest flood events on record on May 21 and May 28, respectively, and the events are still ongoing.See Mississippi River Flood History.
Flooding Dangers
Most large cities have constructed levies and other flood defenses designed to protect homes and businesses as much as possible. However, as the Great Flood of 1993 demonstrated, this is not always possible when historic flooding is occurring. Kliesen, Kevin. “The Economics of Natural Disasters.” Regional Economist, April 1994. Moreover, smaller towns in or near flood-prone areas without adequate flood protection face much higher risks of damaging floodwaters.
Agricultural and rural areas face perhaps the greatest danger if this year’s flood forecast is accurate. As the NOAA report showed, those states that face the greatest risk of major or moderate flooding produce a large percentage of the nation’s corn and soybean crops. Those states are also major producers of pork and beef.
Other industries also face significant disruptions—most notably the transportation sector, which moves agricultural and non-agricultural manufactured goods across an elaborate network of interstate highways and railroads across the Midwest and Plains states.
For the U.S. farm sector, major flooding this spring is another body blow. According to projections from the Department of Agriculture, real net farm income is forecast to be $66 billion in 2018, less than half its level from five years earlier.Johansson, Robert. “The Outlook for U.S. Agriculture—2019: Growing Locally, Selling Globally (PDF).” 95th Agricultural Outlook Forum, Arlington, Va., Feb. 21-22, 2019. The weakness in farm income is largely the result of several years of bumper crops leading to lower prices. More recently, tariffs imposed by China have slashed soybean exports and, thus, spot prices for soybeans. This development will also contribute to lower farm incomes.
Corn and Soybean Planting Delayed
This year’s major flooding in a large part of the nation’s breadbasket could seriously dent this year’s corn and soybean production—and, thus, farm income—if waterlogged fields prevent farmers from planting their fields in a timely fashion. Only 16% of soybean acres were planted through the week ending May 26, compared to 40% by the same time historically. The figure below illustrates the difference in soybean planting progress between May 2018 and May 2019.
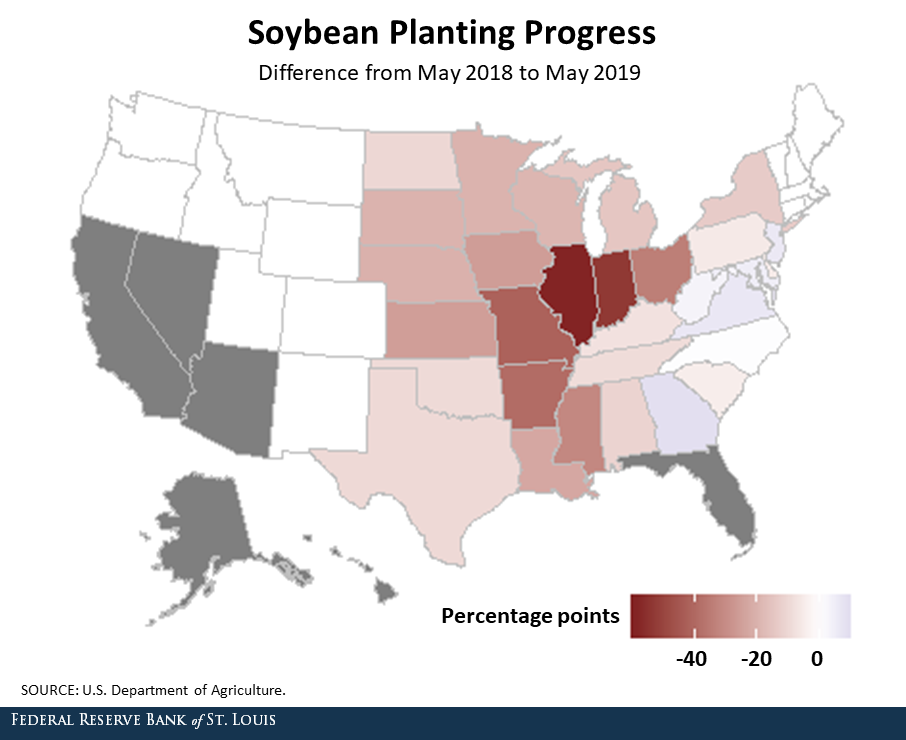
Illinois and Indiana are among the most delayed states, with soybean acres behind last year’s planting progress by 59 and 54 percentage points, respectively.
In the past, soybean farmers have been able to extend the planting season into July to accommodate weather delays. However, corn planting generally wraps up in June nationally, and only 40% of corn acres were planted through the week ending May 26. During the severe flooding of 1993, 45% of corn acres were planted by the end of May.
Historically, though, approximately 70% of corn acres are planted by this time of year. As seen in the figure below, states in the Midwest are farthest behind corn planting progress.
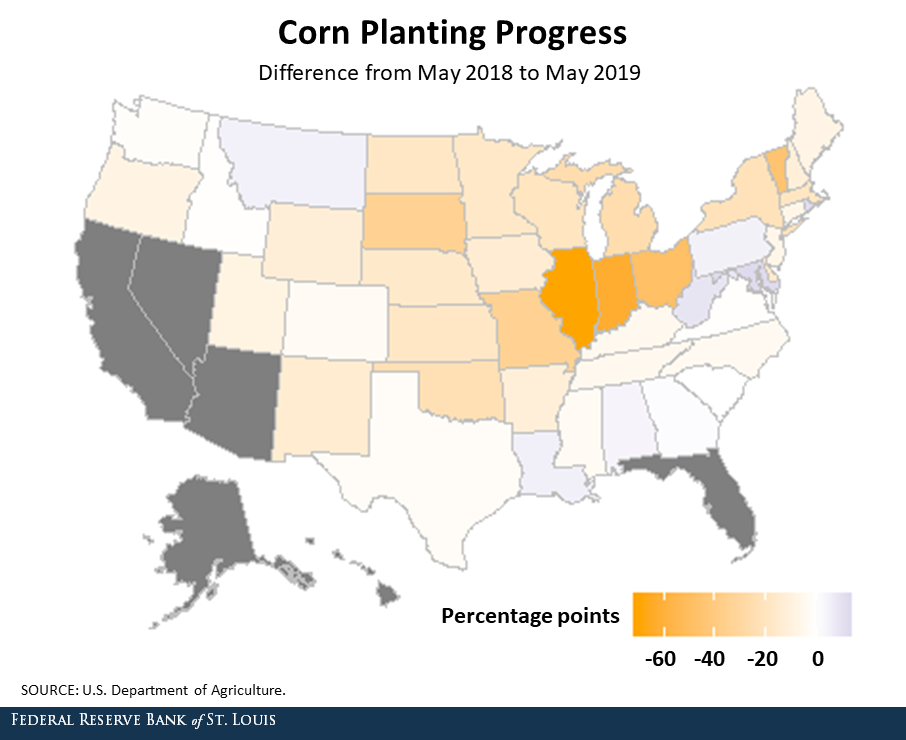
Corn acreage in Illinois, Indiana and Ohio lags last year’s progress by 70, 63 and 49 percentage points, respectively. All else equal, lower production will lead to higher prices. Some farmers, then, will benefit at the expense of others.
Crop Prices
For an historical perspective, the figure below shows the index of weekly crop prices from October 1992 to May 1994—the period encompassing the Great Flood of 1993—and October 2018 to May 2019. The two vertical lines indicate the last week of March (spring planting preparations) and the last week of September (fall harvest) for each period.
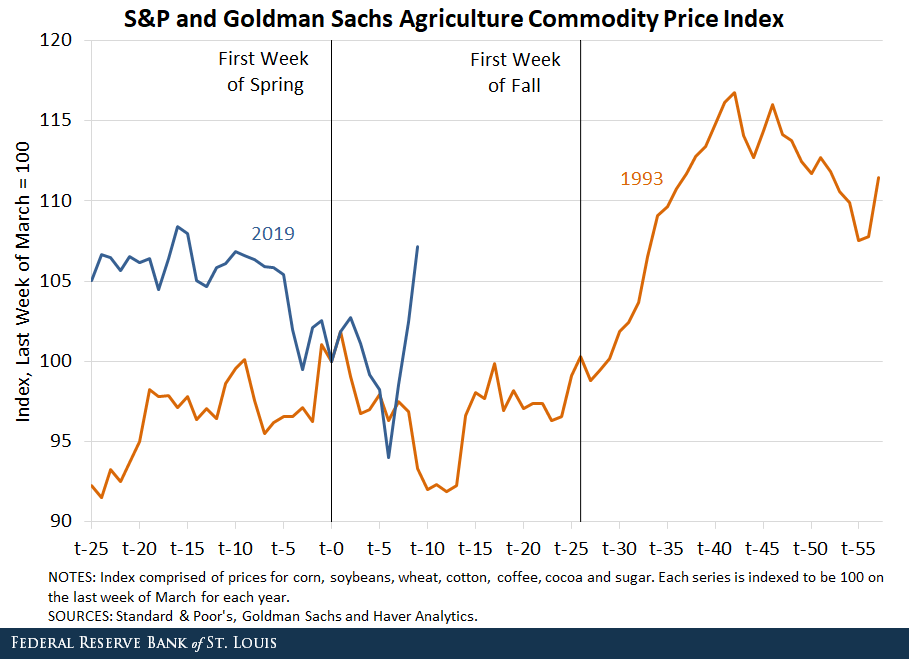
The 1993 episode shows that severe flooding can reduce crop production by significant amounts, leading to higher prices. Crop prices trended lower during the spring months of 1993. Then, prices began to increase from early June until mid-July before leveling off until late September.
At harvest time, the full scope of the flood damage on the nation’s corn and soybean crops became apparent. According to the USDA, corn production fell by a third (9.5 billion bushels to 6.3 billion bushels) in 1993 and was the smallest since the 1988 drought. Soybean production also fell in 1993, but by much less (14.6%). In response, prices soared. From the week ending Sept. 10, 1993, to the week ending Jan. 7, 1994, the crop price index rose by 20%.
A similar pattern has developed this year. However, the spike in commodity prices has been considerably more pronounced. Over the past three weeks, prices for corn, soybeans and wheat have surged 8.5%, 21.4% and 18.4%, respectively.
All else equal, higher prices should lead to higher farm incomes. However, if the decline in prices stems from a reduction in production, farm incomes can fall. Indeed, despite higher prices, farm income declined in 1993 because of the production shortfall. Real net farm income declined by $2.7 billion in 1993, or a 3% decline from the average of the previous five years.
Higher prices could also boost the prices consumers pay for foodstuffs, though raw commodities are generally a relatively small percentage of the overall food bill. Still, in the 1993 episode, as seen in the figure below, higher corn and soybean prices helped exert some upward pressure on food prices.
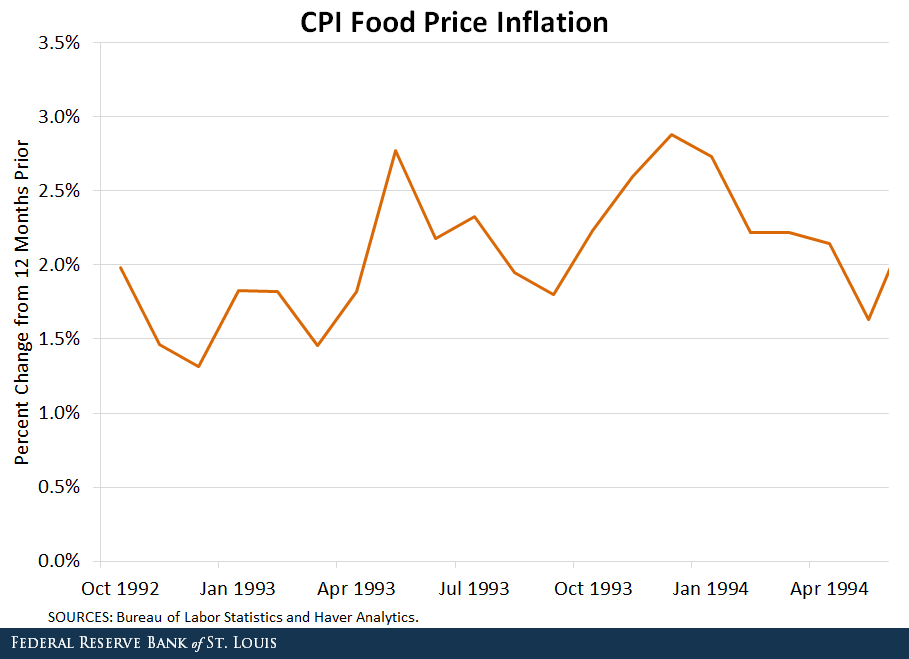
Food price inflation—as measured by the consumer price index—rose from about 1.5% in March 1993 to a little less than 3% by the end of 1993.
Effects of Flooding on Crop Prices and Production?
So, what might be the eventual effect of a major flooding on crop prices and production this year? It is much too early to tell at this point, since the full scope of flooded corn and soybean acreage won’t be known for a while. Although corn and soybean prices have risen sharply over the past three weeks, the volume of inventories (stocks)—particularly for soybeans—might be one factor that mitigates a flood-spawned surge in corn and soybean prices.
The final figures show the volume of ending stocks for corn and soybeans from 1985 to 2018.
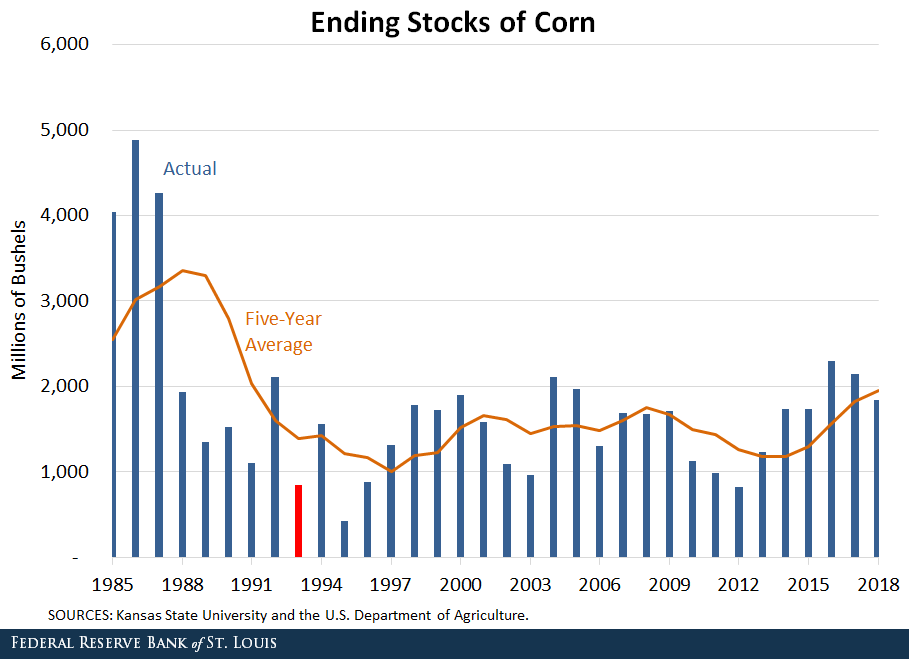
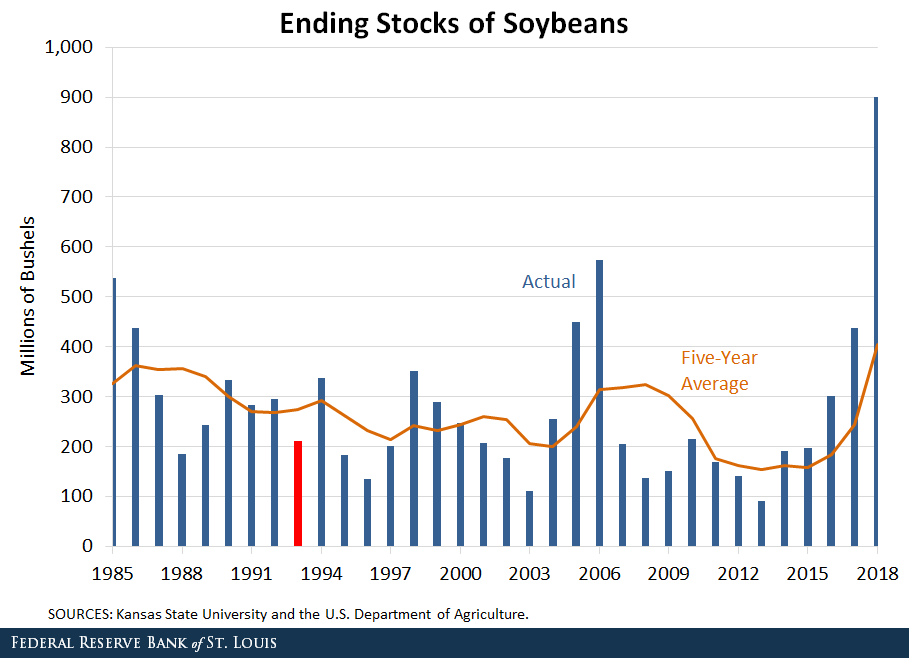
Ending stocks are equal to the current year’s production (supply) less the portion of the crop that is used for domestic purposes (demand)—such as food, feed grains and alternative energy production (which includes corn ethanol or soy diesel)—and the portion that is exported.
Ending corn stocks were at a five-year high in 1992, but then dropped sharply in 1993, helping to lift corn prices. This year’s situation is somewhat similar. Several years of good harvests have resulted in an upswing in corn stocks, with the five-year average at its highest level since 1991.
A similar situation exists with soybean inventories, only more so. In 2018, ending stocks of soybeans were 900 million bushels, the highest level on record (back to 1973).
In short, unless exports to China ramp up again, this year’s potential flood-induced production shortfall could have only modest further effects on soybean prices, with perhaps more of an effect on corn prices. Still, as the 1993 episode demonstrated, prices could spike further if this year’s flooding turns out to sharply curtail production.
Notes and References
1 Spring Outlook: Historic, widespread flooding to continue through May.” National Oceanic and Atmospheric Administration, March 21, 2019.
3 The Morganza Spillway is scheduled to open today, which was postponed from June 2 as upstream rivers have pushed flood waters down more slowly than expected.
4 See Mississippi River Flood History.
5 Kliesen, Kevin. “The Economics of Natural Disasters.” Regional Economist, April 1994.
6 Johansson, Robert. “The Outlook for U.S. Agriculture—2019: Growing Locally, Selling Globally (PDF).” 95th Agricultural Outlook Forum, Arlington, Va., Feb. 21-22, 2019.
Additional Resources
- Regional Economist: The Economics of Natural Disasters
- On the Economy: Economic Effects: Hurricane Harvey vs. Hurricanes Katrina and Rita
- Dialogue with the Fed: The Economic Impact of Natural Disasters


Citation
Kevin L. Kliesen and Kathryn Bokun, ldquoCrop Prices and Flooding: Will 2019 Be a Repeat of 1993?,rdquo St. Louis Fed On the Economy, June 6, 2019.
This blog offers commentary, analysis and data from our economists and experts. Views expressed are not necessarily those of the St. Louis Fed or Federal Reserve System.
Email Us
All other blog-related questions