Areas in Financial Distress Are More Likely to Stay that Way

Among Americans with a credit score, 23% had borrowed at least 80% of their credit limit on bank credit cards at some point during 2018. We refer to their households as being in “financial distress,” because they are more vulnerable to declines in key economic variables like income, home values and employment.
When income decreases and there is reason to believe that the decrease will be temporary, people may borrow to avoid cutting their consumption. Households that have already used up a large portion of their credit limits have a more limited ability to do that. In this post, we will explore how the financial state of individuals carries over to define persistent characteristics of the ZIP codes in which they live.
Persistence in Financial Distress
My (Juan’s) paper “The Persistence of Financial Distress”—co-authored with Kartik Athreya and Jose Mustre-del-Río—showed that being up against a credit constraint is rarely a one-time experience for borrowers. People who reach their credit limits today are about twice as likely to be at their credit limit again four years from now relative to people who are not currently at their limits.
Therefore, if a community is filled with people who individually experience persistent financial distress, we would expect that the community as a whole will be characterized by persistent financial distress.
Financial Distress and CL80
To test this, we used data from our recent working paper “Consumption in the Great Recession: The Financial Distress Channel”—co-authored with Athreya and Mustre-del-Río. The paper uses ZIP code-level information to evaluate the role of financial distress during the Great Recession.
The variable of interest is “CL80,” which represents the percentage of people in a ZIP code who have borrowed at least 80% of their credit card limits in a given year. We divided U.S. ZIP codes into five equal groups by population each year in order of increasing CL80, then tracked how ZIP codes moved between these groups over time.
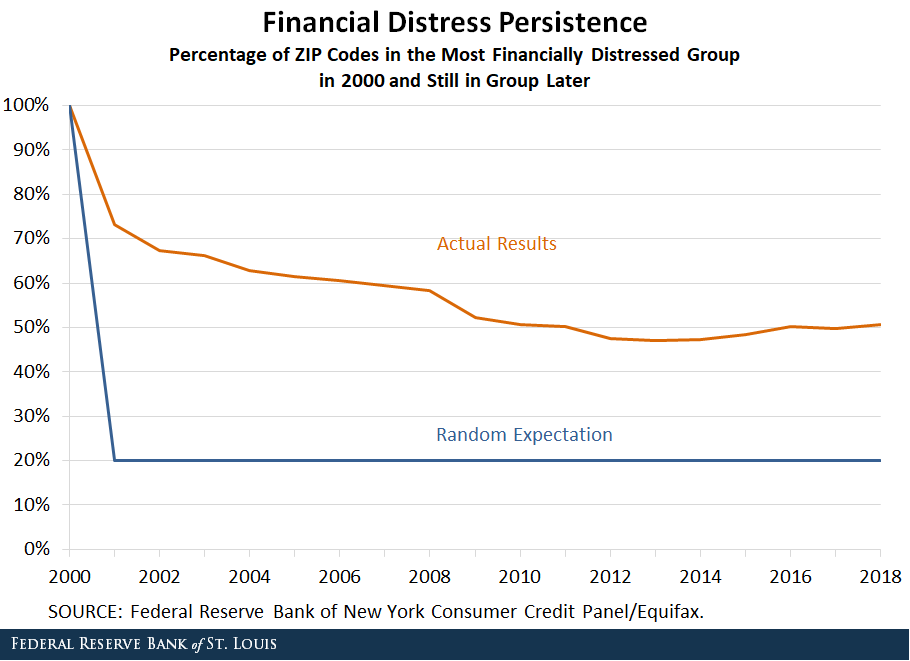
Persistence would imply that ZIP codes with the most financial distress in one year will likely still be in the most financially distressed group years later. It turns out that this hypothesis is correct. The figure below graphs the percentage of ZIP codes that were in the most financially distressed group in 2000 and remained in that group over time.

About 60% of the original group were still in the most financially distressed group in 2008, and just over 50% were still in the most financially distressed group come 2018.
For comparison, the blue line shows what this path would have been if financial distress was a completely random occurrence and people had no control over their credit card borrowing. Then, the odds of any ZIP code being in the bottom 20% would be just that—20%—regardless of its history.
Notice that 18 years later, the chances of being in the most financially distressed group were still over twice as high as random chance would predict. While the metrics used for ZIP codes and individuals are not precisely the same, this degree of persistence is much higher than what is observed at the individual level over similar time frames. This provides suggestive evidence there is more going on here than ZIP codes being in high financial distress simply because their residents happen to be of the type that get into financial distress.
While it will take more research to disentangle the sources of this “excess” persistence, one possibility is that people with a tendency to use large portions of their credit limit often go to live in neighborhoods with similar people, reinforcing the existing trend.
Additional Resources
- On the Economy: Financial Distress Differences Seen at the ZIP Code Level
- On the Economy: How Persistent Is Financial Distress?
- On the Economy: Families in Financial Distress Are More Likely to Stay in Distress
Citation
Juan M. Sánchez and Ryan Mather, ldquoAreas in Financial Distress Are More Likely to Stay that Way,rdquo St. Louis Fed On the Economy, Dec. 24, 2019.
This blog offers commentary, analysis and data from our economists and experts. Views expressed are not necessarily those of the St. Louis Fed or Federal Reserve System.
Email Us
All other blog-related questions


