


Comparing Measures of Sovereign Risk
Country risk is the risk associated with investing in a particular country—that is, the risk of not getting your investment back. There are several measures of country risk, such as:
- Agency-issued credit ratings
- Market-determined credit default swap spreads
- The Institutional Investor Index
In this blog post, we look at these different measures of country risk and study the correlation among them. This is interesting because if there are big discrepancies among them, looking at only one of them is not very informative while if they are highly correlated, following one is enough to have a good sense of the degree of risk in an economy. We focus our attention on a sample of oil-producing nations with a wide range of economic development.
Agency-Issued Credit Ratings at a Glance
Credit ratings by agencies such as Moody's and Fitch are commonly used measures of sovereign risk. These agencies assign risk based on rating symbols. The two tables below provide brief descriptions of what each symbol signifies about credit risk.
Moody’s Global Long-Term Rating Scale
| Rating | Description |
|---|---|
| Aaa | Obligations rated Aaa are judged to be the highest quality, subject to the lowest level of credit risk. |
| Aa | Obligations rated Aa are judged to be of high quality and are subject to very low credit risk. |
| A | Obligations rated A are judged to be upper-medium grade and are subject to low credit risk. |
| Baa | Obligations rated Baa are judged to be medium-grade and subject to moderate credit risk and, as such, may possess certain speculative characteristics. |
| Ba | Obligations rated Ba are judged to be speculative and are subject to substantial credit risk. |
| B | Obligations rated B are considered speculative and are subject to high credit risk. |
| Caa | Obligations rated Caa are judged to be speculative of poor standing and are subject to very high credit risk. |
| Ca | Obligations rated Ca are very highly speculative and are likely in, or very near, default with some prospect of recovery of principal and interest. |
| C | Obligations rated C are the lowest rated and are typically in default, with little prospect for recovery of principal or interest. |
| Federal Reserve Bank of St. Louis | |
| NOTES: Moody's appends numerical modifiers 1, 2 and 3 to each generic rating classification from Aa through Caa. The modifier 1 indicates that the obligation ranks in the higher end of its generic rating category; the modifier 2 indicates a mid-range ranking; and the modifier 3 indicates a ranking in the lower end of that generic rating category.
SOURCE: Moody's Investors Service, Rating Symbols and Definitions (PDF), June 2018. |
|
Fitch International Credit Rating Scale
| Rating | Description |
|---|---|
| AAA | Highest credit quality. AAA ratings denote the lowest expectation of default risk. They are assigned only in cases of exceptionally strong capacity for payment of financial commitments. This capacity is highly unlikely to be adversely affected by foreseeable events. |
| AA | Very high credit quality. AA ratings denote expectations of very low default risk. They indicate very strong capacity for payment of financial commitments. This capacity is not significantly vulnerable to foreseeable events. |
| A | High credit quality. A ratings denote expectations of low default risk. The capacity for payment of financial commitments is considered strong. This capacity may, nevertheless, be more vulnerable to adverse business or economic conditions than is the case for higher ratings. |
| BBB | Good credit quality. BBB ratings indicate that expectations of default risk are currently low. The capacity for payment of financial commitments is considered adequate, but adverse business or economic conditions are more likely to impair this capacity. |
| BB | Speculative. BB ratings indicate an elevated vulnerability to default risk, particularly in the event of adverse changes in business or economic conditions over time; however, business or financial flexibility exists that supports the servicing of financial commitments. |
| B | Highly speculative. B ratings indicate that material default risk is present, but a limited margin of safety remains. Financial commitments are currently being met; however, capacity for continued payment is vulnerable to deterioration in the business and economic environment. |
| CCC | Substantial credit risk. Default is a real possibility. |
| CC | Very high levels of credit risk. Default of some kind appears probable. |
| C | Near default. A default or default-like process has begun or the issuer is in standstill; or, for a closed funding vehicle, payment capacity is irrevocably impaired. |
| RD | Restricted default. |
| D | D ratings indicate an issuer that in Fitch's opinion has entered into bankruptcy filings. |
| Federal Reserve Bank of St. Louis | |
| NOTES: Within rating categories, Fitch may use modifiers. The modifiers "+" or "-" may be appended to a rating to denote relative status within major rating categories. Such suffixes are not added to AAA ratings and ratings below the CCC category.
SOURCE: Fitch Ratings: Rating Definitions. |
|
Comparing the Institutional Investor Index with Credit Ratings
On the other hand, the Institutional Investor Index (III from now on) is a country risk rating based on survey responses from senior economists and sovereign risk analysts at leading global banks, as well as money management and security firms. The ratings are on a scale from 0 to 100, where 100 represents the least likelihood of default. Responses are weighted based on the global exposure of the respondents’ institutions. These ratings have been published biannually since the late 1970s.The last Institutional Investor Index was published March 2016.
In order to compare the III with Moody’s and Fitch credit ratings data, we merge the credit rating that has been assigned the longest to a sovereign during a particular semester with the respective semester III reading. Since the III is a continuous variable (i.e. takes on a value between 0 and 100), and credit ratings are a discrete variable (i.e. a factor variable over the ordinal ratings labels), we visualize their correlation with box plots.
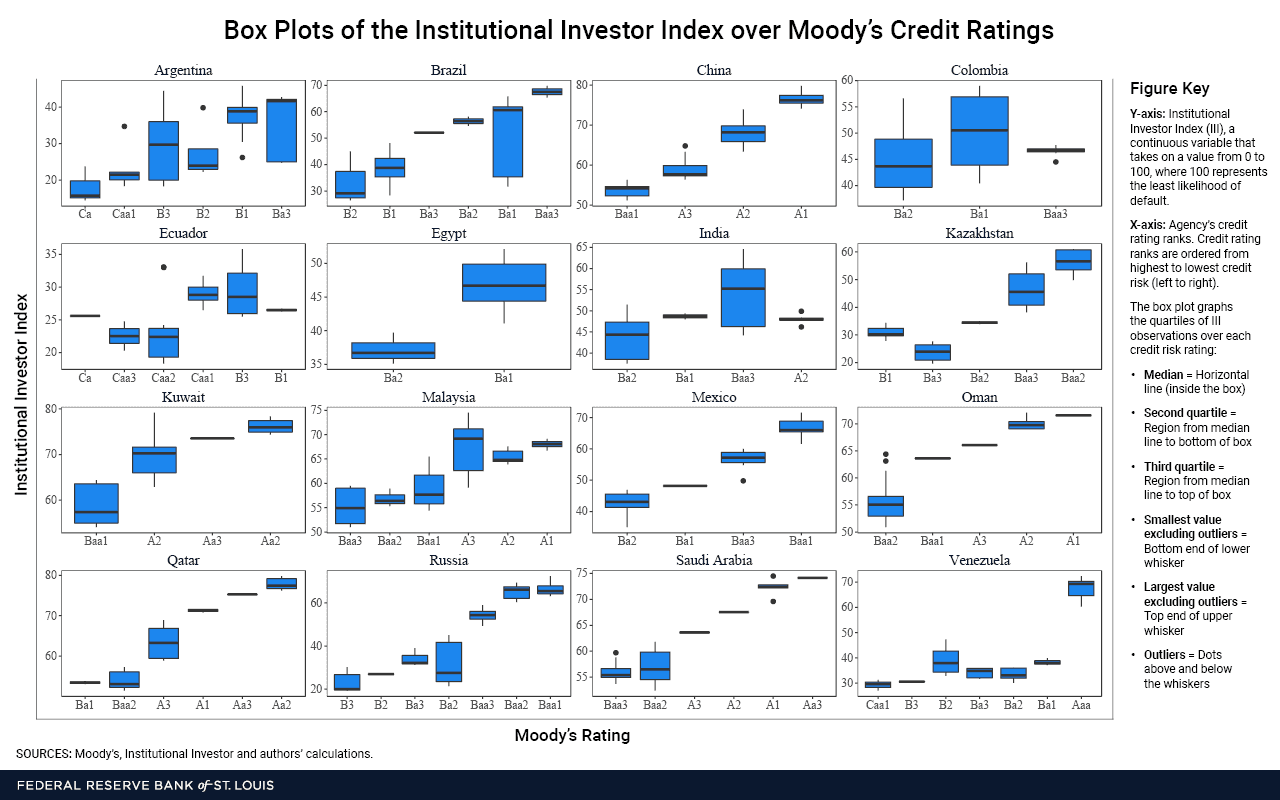
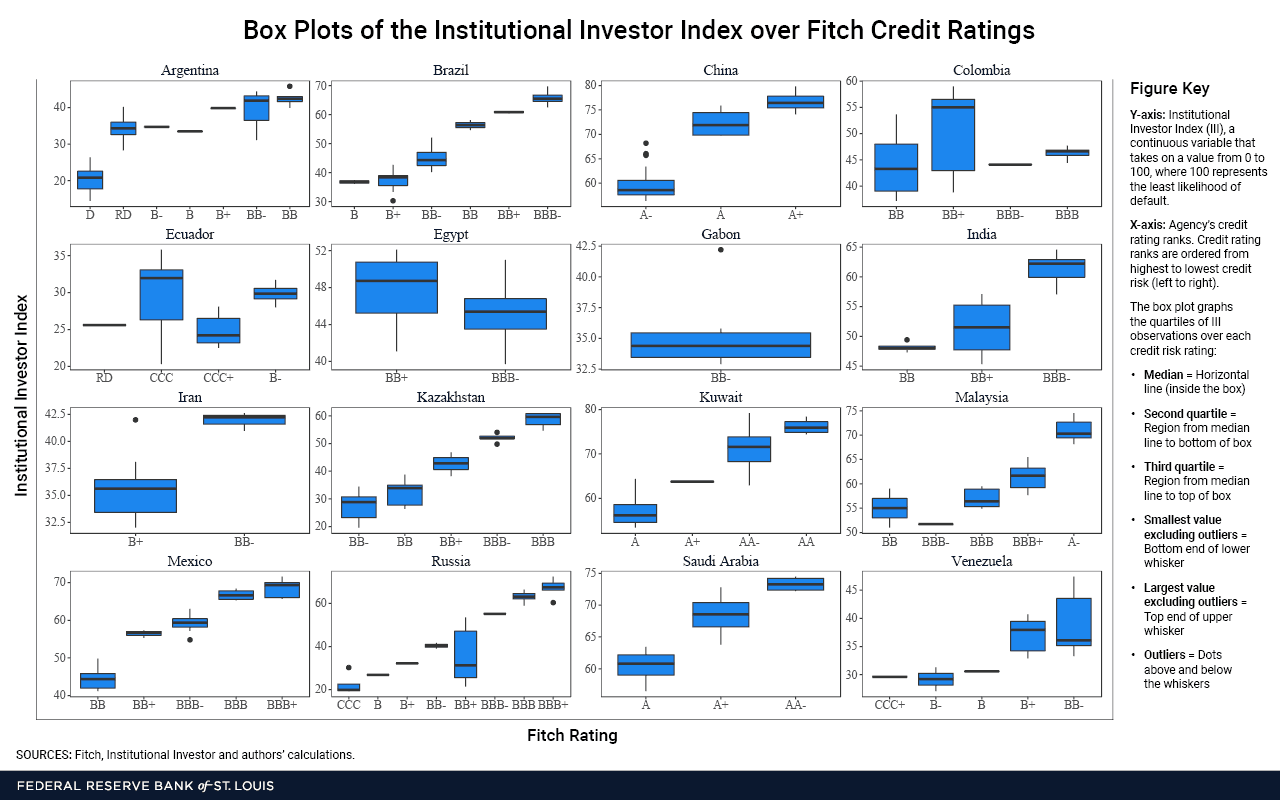
Box Plots of Institutional Investor Index over Moody’s and Fitch Ratings
Box plots are used to show the overall dispersion of a continuous variable over groups. In our case, the y-axis is the continuous III, and the x-axis is the agency's credit rating ranks. The credit rating ranks are ordered along the x-axis from highest to lowest credit risk (from left to right).
The box plot then graphs the quartiles of III observations over each credit risk rating. The horizontal line inside the box is the median. The second quartile is the region from the median line to the bottom of the box, while the third quartile is the region from the median line to the top of the box. The bottom end of the lower whisker is the smallest value excluding outliers, and the top end of the upper whisker is the largest value excluding outliers. Outliers are plotted as dots above and below the whisker of the box. Outliers above the upper whisker are 1.5 times greater than the third quartile, while outliers below the lower whisker are 1.5 times lower than the second quartile.
The first figure plots the III over Moody's credit risk ratings, and the second figure plots the III over Fitch credit risk ratings.
Click/tap figure to enlarge | View as PDF
Click/tap figure to enlarge | View as PDF
We can see visually from the distributional characteristics of the III over Moody's and Fitch credit risk ratings that each sovereign's corresponding III measure tends to increase as its credit rating improves. This indicates that the III is correlated with these other credit ratings.
Comparing the Institutional Investor Index with Credit Default Swap Spreads
Apart from the Moody’s and Fitch credit ratings, there are also the credit default swap (CDS) spreads. CDS spreads are a type of financial instrument in which the seller agrees to compensate the buyer in the event that the sovereign defaults on its debt during the given term. The spread is a series of payments that buyers make to sellers to insure their investment. Therefore, a higher CDS spread reflects greater risk.
CDS spreads can provide a real-time market perspective of sovereign risk. However, CDS spreads did not begin until the late 1990s and, for many countries in our sample, there are no data until the mid-2000s. Also, some CDS markets for certain countries may not be highly liquid, which can lead to infrequent observations and cause the price to be susceptible to outliers.
In order to compare CDS spreads with the III, we take semester averages of CDS spreads and merge each with its respective III reading. Then we calculate correlations between the CDS spread and the III, as shown in the table below.
Correlation between 5-Year CDS Spread and Institutional Investor Index
| Country | Correlation |
|---|---|
| Argentina | -0.5432 |
| Brazil | 0.0908 |
| China | 0.5886 |
| Colombia | -0.6407 |
| France | -0.6836 |
| Greece | -0.7348 |
| Italy | -0.8239 |
| Malaysia | 0.2535 |
| Mexico | 0.0295 |
| Netherlands | 0.2405 |
| Norway | -0.1617 |
| Poland | -0.7980 |
| Russia | 0.3076 |
| Spain | -0.7830 |
| Thailand | -0.1554 |
| United Kingdom | -0.1300 |
| United States | -0.3759 |
| Federal Reserve Bank of St. Louis | |
| SOURCES: Bloomberg, Institutional Investor and authors' calculations. | |
We see that 11 of the 17 countries in our sample have negative correlations. So as CDS spreads increase (signifying markets perceive the country as riskier), the III falls (signifying that Institutional Investor magazine also perceives the country as riskier). The rest of the countries have a weak positive correlation.
Conclusion
We see that the III is correlated with other measures of sovereign risk such as agency credit ratings and CDS spreads. This makes the III a useful measure of sovereign risk, with the advantage of having long historical data that are convenient for studying sovereign default.
Notes and References
1 The last Institutional Investor Index was published March 2016.
Additional Resources
- On the Economy: Oil Producing Countries and Repaying Debts
- On the Economy: The Default Risk of Oil-Producing Countries
- Timely Topics: Oil-Producing Countries and Debt


Citation
Paulina Restrepo-Echavarría and Brian Reinbold, ldquoComparing Measures of Sovereign Risk,rdquo St. Louis Fed On the Economy, Sept. 10, 2018.
This blog offers commentary, analysis and data from our economists and experts. Views expressed are not necessarily those of the St. Louis Fed or Federal Reserve System.
Email Us
All other blog-related questions