How Do the Hours Americans Work Compare to the Rest of the World?
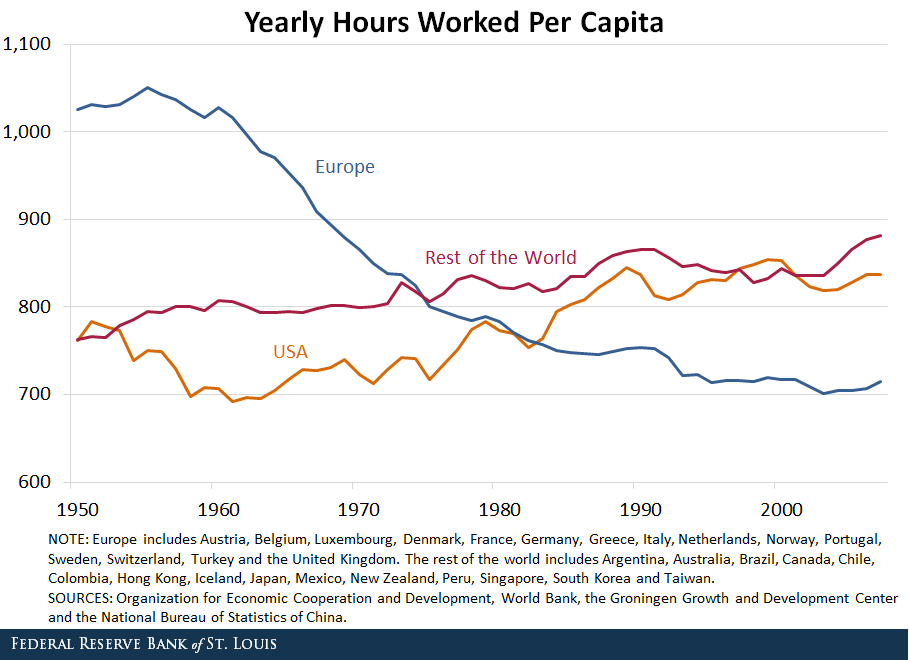
Macroeconomists have long been interested in understanding time series trends in aggregate hours worked. Long-term trend changes in per capita hours worked across countries are, in fact, large. The figure below shows yearly hours worked per capita aggregated to Europe, Europe includes the following countries: Austria, Belgium, Luxembourg, Denmark, France, Germany, Greece, Italy, Netherlands, Norway, Portugal, Sweden, Switzerland, Turkey and the United Kingdom. the U.S. and the rest of the world (ROW). The ROW includes the following countries: Argentina, Australia, Brazil, Canada, Chile, Colombia, Hong Kong, Iceland, Japan, Mexico, New Zealand, Peru, Singapore, South Korea and Taiwan.

The figure shows a precipitous drop in per capita hours worked of about 30 percent from 1950 to 2007 for Europe. However, they steadily rose in the U.S. and the ROW during the same period. Not only do we see long-term changes in hours worked for these three regions, the trend change in European countries is significant.
The Effect of Taxes
A paper by Lee Ohanian, Andrea Raffo and Richard Rogerson found that differences in labor taxes explained most of this steep decline. Ohanian, Lee; Raffo, Andrea; and Rogerson, Richard. “Long-term changes in labor supply and taxes: Evidence from OECD countries, 1956-2004,” Journal of Monetary Economics, 2008, Vol. 55, Issue 8, pp. 1353-62.
Their paper uses the neoclassical growth model to account for differences in hours worked across some Organization for Economic Cooperation and Development countries. The model augmented to incorporate taxes on labor income and consumption can account for much of these changes.
The model broadly accounts for differences in magnitude of hours worked between countries over the period of 1956-2004, and it can attribute most of the changes in hours worked to taxes and not to other factors.
High taxes on wages and salaries can discourage people from working. Labor taxes have generally increased in Europe from 1950 to the mid-1990s, and we see that per capita hours worked declined during this same period. From the mid-1990s to mid-2000s, labor taxes levied in Europe begin to level off, and we see that per capita hours worked level off as well.
Additional Factors
The paper’s authors presented further statistical evidence that labor taxes explained the majority of this decline even after controlling for other potential determinants of cross-country differences in hours worked. Although Europe has stricter regulations on employment protections and more generous labor benefits, these other factors do little to explain this decline.
Although stricter labor regulations can potentially discourage hiring, high labor taxes have mainly driven the decline in per capita hours by affecting the supply of labor.
Notes and References
1 Europe includes the following countries: Austria, Belgium, Luxembourg, Denmark, France, Germany, Greece, Italy, Netherlands, Norway, Portugal, Sweden, Switzerland, Turkey and the United Kingdom.
2 The ROW includes the following countries: Argentina, Australia, Brazil, Canada, Chile, Colombia, Hong Kong, Iceland, Japan, Mexico, New Zealand, Peru, Singapore, South Korea and Taiwan.
3 Ohanian, Lee; Raffo, Andrea; and Rogerson, Richard. “Long-term changes in labor supply and taxes: Evidence from OECD countries, 1956-2004,” Journal of Monetary Economics, 2008, Vol. 55, Issue 8, pp. 1353-62.
Citation
Paulina Restrepo-Echavarría and Brian Reinbold, ldquoHow Do the Hours Americans Work Compare to the Rest of the World?,rdquo St. Louis Fed On the Economy, Oct. 8, 2018.
This blog offers commentary, analysis and data from our economists and experts. Views expressed are not necessarily those of the St. Louis Fed or Federal Reserve System.
Email Us
All other blog-related questions


