


National Homeownership Rates in 2005: A Powerful Negative Predictor of Post-Crisis Recovery
KEY TAKEAWAYS
- Our research shows a strong correlation between a country’s homeownership rate pre-crisis and both its per capita growth and homeownership rate post-crisis.
- Higher homeownership rates before the crisis predicted larger growth declines and vice versa.
- The large drop in U.S. homeownership from 2005 to 2015 reflects the severity of the housing crisis here.
While all major advanced economies were negatively affected by the 2007-09 financial crisis, their experiences varied greatly. That said, new research reveals a common thread: A country’s homeownership rate in 2005 turned out to be a powerful negative predictor of both its post-crisis growth trajectory and subsequent change in national homeownership rate.
It makes sense for these outcomes to be related, since problems in housing and mortgage markets were at the center of the financial crisis and Great Recession. Does this prior global experience now suggest caution when advocating high homeownership rates? Could such rates increase various countries’ susceptibility to sharp economic downturns?
Homeownership Rates before and after the Crisis
Over the past few decades, national homeownership rates have varied widely across and within the 13 advanced economies discussed here. Country coverage is based on Table 1 in Goodman and Mayer (2018). The analysis in this article excludes five countries listed in their table that are not likely to be representative of other advanced economies due to being a city-state (Singapore); being an emerging economy (Mexico); or having adopted market economies after the sample period began (Bulgaria, Czech Republic, Slovenia). (See Table 1.) In 1990, homeownership rates were below 50 percent in Switzerland, Germany and Sweden, while rates in Spain and Ireland were above 75 percent. By 2005, homeownership rates had converged somewhat, but the cross-country span remained large. The change in national homeownership rates between 2005 and 2015 ranged from an increase of 12.9 percentage points in Switzerland to declines of more than 8 percentage points in Ireland and Spain.
The U.S. homeownership rate was at or slightly above the median rate for this group in every year shown except 2015, when it was just below the median rate. The decline in the U.S. homeownership rate between 2005 and 2015 of 5.2 percentage points was much greater than the group’s median change, which was Canada’s 0.1 percentage point decline. The large drop in homeownership in the U.S. reflects the severity of the housing crisis here.
Table 1
National Homeownership Rates (Percent)
| 1990 | 2000 | 2005 | 2010 | 2015 | ||
|---|---|---|---|---|---|---|
| Canada | 62.6 | 65.8 | 67.1 | 69.0 | 67.0 | |
| Denmark | 54.5 | 51.0 | 66.6 | 66.6 | 62.7 | |
| Finland | 67.0 | 61.0 | 71.8 | 74.3 | 72.7 | |
| France | 54.4 | 54.8 | 61.8 | 62.0 | 64.1 | |
| Germany | 37.3 | 41.3 | 53.3 | 53.2 | 51.9 | |
| Ireland | 80.0 | 78.9 | 78.2 | 73.3 | 70.0 | |
| Italy | 64.2 | 69.0 | 72.8 | 72.6 | 72.9 | |
| Japan | 63.2 | 64.9 | 63.1 | 62.4 | 64.9 | |
| Spain | 77.8 | 82.0 | 86.3 | 79.8 | 78.2 | |
| Sweden | 41.0 | 67.0 | 68.1 | 70.8 | 70.6 | |
| Switzerland | 31.3 | 34.6 | 38.4 | 44.4 | 51.3 | |
| United Kingdom | 65.8 | 69.1 | 69.2 | 65.7 | 63.5 | |
| United States | 63.9 | 66.8 | 68.9 | 66.9 | 63.7 | |
| Median | 63.2 | 65.8 | 68.1 | 66.9 | 64.9 | |
SOURCE: Goodman and Mayer (2018).Goodman, Laurie S.; and Mayer, Christopher. "Homeownership and the American Dream." Journal of Economic Perspectives, Winter 2018, Vol. 32, No. 1, Table 1.
- FEDERAL RESERVE BANK OF ST. LOUIS
[back to text]Growth Slowdowns after the Crisis
As shown in Table 2, average per capita growth in the U.S. fell from an annualized 1.96 percent in the 15 years before the financial crisis to 0.73 percent in the 12 years immediately after the crisis. To match the available homeownership rates, the author refers to the 1990-2005 period as "pre-crisis" and the 2005-17 period as "post-crisis." All of the conclusions discussed in this article are essentially unchanged if the break point for the growth slowdown is chosen to be one or two years earlier or later than 2005 (i.e., between 2003 and 2007). The growth figures cited in this article refer to the average annualized continuously compounded growth rates of per capita real GDP at 2011 purchasing-power-parity exchange rates. The data are from the International Monetary Fund’s World Economic Outlook database, April 2018 edition. See http://www.imf.org/external/pubs/ft/weo/2018/01/weodata/index.aspx. This drop of 1.23 percentage points turns out to be the median change for the 13 advanced economies discussed here. The range of experience across the 13 countries was large, from slight increases for Germany and Switzerland to a decline of about 2 percentage points for Ireland.
Table 2
Average Annualized per Capita Growth Rates
|
1990-2005 (Percent) |
2005-17 (Percent) |
Difference (Percentage Points) |
||||
|---|---|---|---|---|---|---|
| Canada | 1.70 | 0.68 | –1.02 | |||
| Denmark | 1.85 | 0.39 | –1.46 | |||
| Finland | 2.01 | 0.33 | –1.68 | |||
| France | 1.43 | 0.46 | –0.97 | |||
| Germany | 1.26 | 1.42 | 0.16 | |||
| Ireland | 5.24 | 3.27 | –1.97 | |||
| Italy | 1.20 | –0.54 | –1.74 | |||
| Japan | 1.02 | 0.75 | –0.27 | |||
| Spain | 2.28 | 0.38 | –1.89 | |||
| Sweden | 1.95 | 1.07 | –0.89 | |||
| Switzerland | 0.59 | 0.72 | 0.13 | |||
| United Kingdom | 2.17 | 0.56 | –1.61 | |||
| United States | 1.96 | 0.73 | –1.23 | |||
| Median | 1.85 | 0.68 | –1.23 | |||
SOURCES: International Monetary Fund’s World Economic Outlook database (2018) and author’s calculations.
NOTE: Growth rates are calculated as the average annualized continuously compounded growth rate of per capita real GDP measured at purchasing power parity for 2011 exchange rates.
- FEDERAL RESERVE BANK OF ST. LOUIS
[back to text]High Homeownership Rates as Predictor of Large Growth Declines …
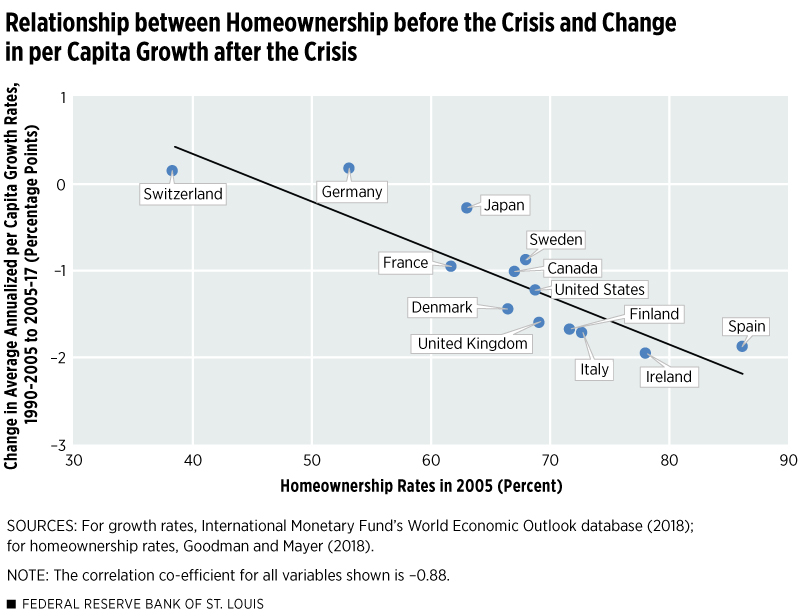
Figure 1 is a scatter plot of the relationship between a country’s average homeownership rate in 2005 and the change in its per capita growth rate between the pre- and post-crisis periods. There is a clear negative relationship, suggesting that higher homeownership rates before the crisis predicted larger growth declines and vice versa. The correlation between these two measures is –0.88, a very strong relationship.
The point representing the U.S. (homeownership rate of 68.9 percent and growth change of –1.23 percentage points) lies precisely on the line representing the average relationship between a country’s 2005 homeownership rate and the change in its per capita growth rate. Thus, the U.S. experience was perfectly representative of, or in line with, other countries’ experiences in this rich-country sample.
… and of Large Declines in Homeownership
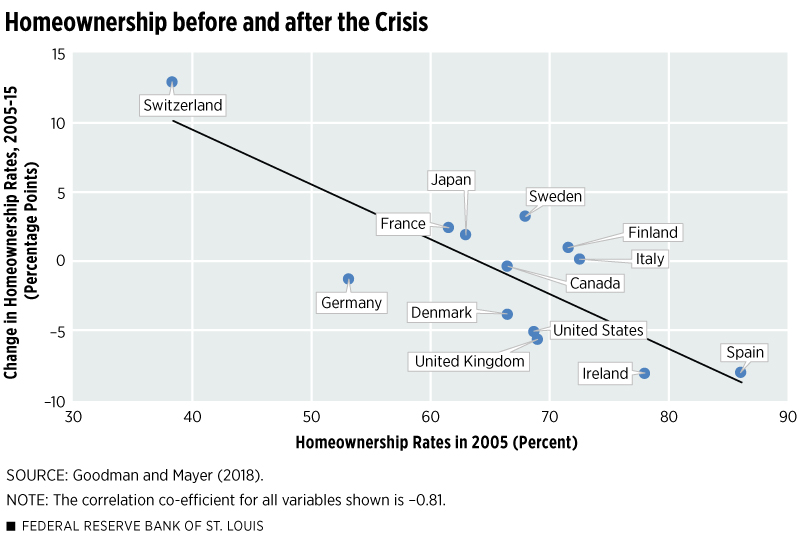
Figure 2 is a scatter plot of the relationship between a country’s average homeownership rate in 2005 and the change in its homeownership rate a decade later. Again, the relationship is negative, indicating that relatively high homeownership rates before the crisis predicted larger homeownership declines through 2015. The correlation between these two measures is –0.81, also a strong relationship.
In terms of homeownership declines, the U.S. experience was worse than average in this sample. The point representing the U.S. (homeownership change of –5.2 percentage points and homeownership rate in 2005 of 68.9 percent) lies noticeably below the line representing the average relationship. Thus, while the crisis affected homeownership more in the U.S. than in other rich countries, the U.S. growth slowdown was no worse than one would expect based on its pre-crisis homeownership rate. This suggests that components of economic growth other than housing were somewhat stronger in the U.S. than elsewhere.
A North Atlantic Robustness Check
Though the countries discussed here are similar in many ways, there are important cross-country differences in housing markets and overall economic structure and performance. If the relationships described above also exist among a smaller, more homogenous group of countries, one might be more confident in drawing conclusions.
A smaller sampling of countries to compare includes the U.S., the United Kingdom and Canada. These English-speaking countries share economic, political and cultural legacies and are all part of the Group of Seven (G7) advanced industrial economies. Also included in the G7 are France, Germany, Italy and Japan.
Remarkably, the results outlined above for the group of 13 advanced economies carry over almost exactly to this smaller group. The correlation between 2005 homeownership rates and subsequent changes in per capita growth rates is –0.85 (vs. –0.88 for the larger sampling); and the correlation between 2005 homeownership rates and subsequent 10-year changes in national homeownership rates is –1.00 (vs. –0.81 for the larger group). Thus, the strong negative relationships between 2005 homeownership rates and subsequent outcomes are present in both the 13-country group as well as in the more homogenous three-country group.
Caution Advised for Countries with High Homeownership Rates
The correlational evidence suggests that countries with relatively high homeownership rates are more susceptible to severe growth slowdowns and reversals in homeownership rates, at least when the source of the economic disruption is housing.
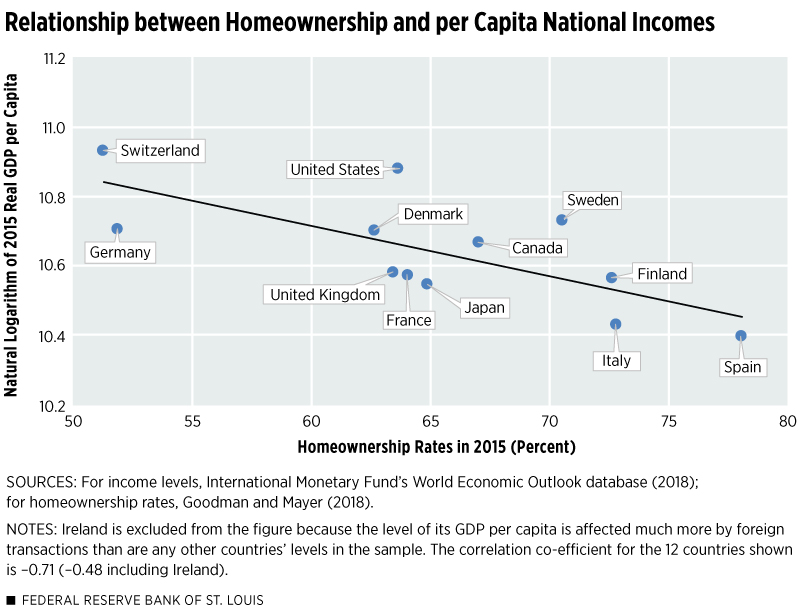
One final, compelling piece of evidence that high homeownership rates may be detrimental to economic performance is the correlation between a country’s level of real GDP per capita and its homeownership rate. (See Figure 3.) In 2015, that correlation was a low –0.48 for the 13 countries discussed here; it was an even lower –0.71 if Ireland is excluded. For national income, the author applies the natural-logarithm transformation. The level of Ireland’s real GDP per capita is unusually high now because its economy is open to very large foreign transactions. In other words, countries with higher homeownership rates were shown to have lower per capita national incomes and vice versa. Such macroeconomic implications likewise suggest caution when advocating homeownership.
Endnotes
- Country coverage is based on Table 1 in Goodman and Mayer (2018). The analysis in this article excludes five countries listed in their table that are not likely to be representative of other advanced economies due to being a city-state (Singapore); being an emerging economy (Mexico); or having adopted market economies after the sample period began (Bulgaria, Czech Republic, Slovenia).
- Goodman, Laurie S.; and Mayer, Christopher. “Homeownership and the American Dream.” Journal of Economic Perspectives, Winter 2018, Vol. 32, No. 1, Table 1.
- To match the available homeownership rates, the author refers to the 1990-2005 period as “pre-crisis” and the 2005-17 period as “post-crisis.” All of the conclusions discussed in this article are essentially unchanged if the break point for the growth slowdown is chosen to be one or two years earlier or later than 2005 (i.e., between 2003 and 2007). The growth figures cited in this article refer to the average annualized continuously compounded growth rates of per capita real GDP at 2011 purchasing-power-parity exchange rates. The data are from the International Monetary Fund’s World Economic Outlook database, April 2018 edition. See http://www.imf.org/external/pubs/ft/weo/2018/01/weodata/index.aspx.
- Also included in the G7 are France, Germany, Italy and Japan.
- For national income, the author applies the natural-logarithm transformation. The level of Ireland’s real GDP per capita is unusually high now because its economy is open to very large foreign transactions.
This article originally appeared in our Housing Market Perspectives publication.

Citation
William R. Emmons, ldquoNational Homeownership Rates in 2005: A Powerful Negative Predictor of Post-Crisis Recovery,rdquo St. Louis Fed On the Economy, June 21, 2018.
This blog offers commentary, analysis and data from our economists and experts. Views expressed are not necessarily those of the St. Louis Fed or Federal Reserve System.
Email Us
All other blog-related questions