How Risky Are Government Intervention Programs?
Financial crises and severe recessions can be very costly for the government. However, the traditional way of measuring these costs—by looking at ex-post spending and revenues—can be a severe underestimate.
Many government interventions in the financial sector consist of asset guarantee and purchase programs that are either:
- Not triggered, meaning the program is created and available, but ends up not being used
- Fully repaid
These programs are known as contingent liabilities; by their very design, there is lot of uncertainty over how costly these programs could end up being for the government.
Measuring the true costs of these government programs therefore requires accounting not just for how much the government spent, but also for how much the government could have spent.
Financial Resources and the Great Recession
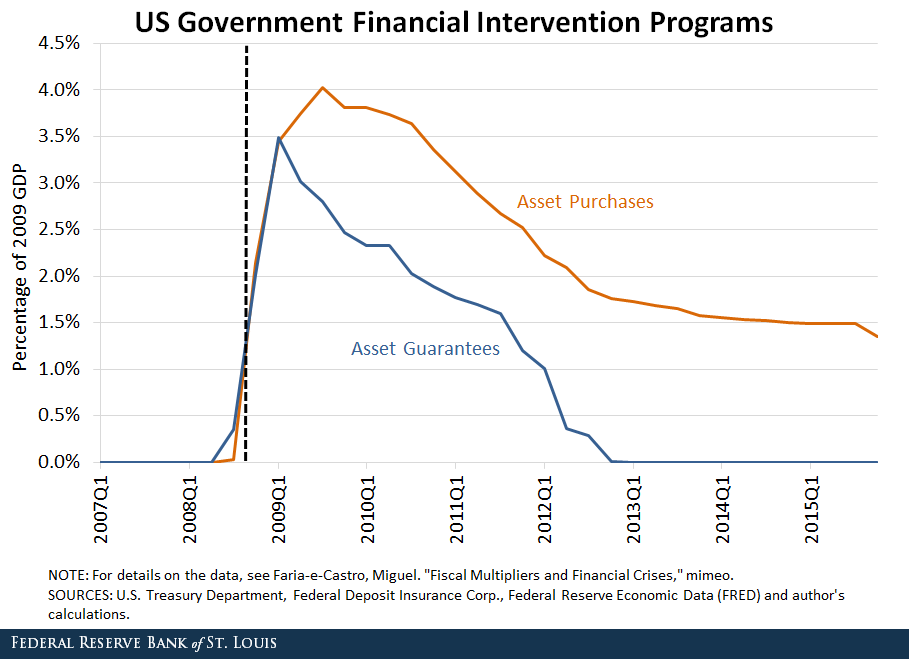
The figure below shows total resources committed to financial sector interventions by the U.S. government during the 2008 financial crisis and subsequent recession, as a percentage of 2009 gross domestic product (GDP).

One of the key policy responses to the crisis was the Troubled Asset Relief Program (TARP), Implemented as part of the Emergency Economic Stabilization Act of 2008, enacted Oct. 3, 2008. through which the U.S. government committed fiscal resources to guarantee and purchase many financial assets. Some of the largest programs under TARP were:
- The Capital Purchase Program (CPP), through which the U.S. Treasury directly purchased preferred stock in bank holding companies
- The Automotive Industry Financing Program, through which the U.S. Treasury purchased equity and guaranteed loans to major automakers
- The guarantee of American International Group’s assets, the world’s largest insurance company at the time
The figure shows that at the peak of the crisis, in early 2009, the government had committed about 7 percent of GDP to these types of programs.
In a worst-case scenario, most of the financial assets purchased and guaranteed by the government could have failed, triggering these guarantees. The federal deficit was close to 10 percent of GDP in 2009, and the figure shows that, under this scenario, the deficit could have been almost twice as large.
Net Costs of Purchase Programs
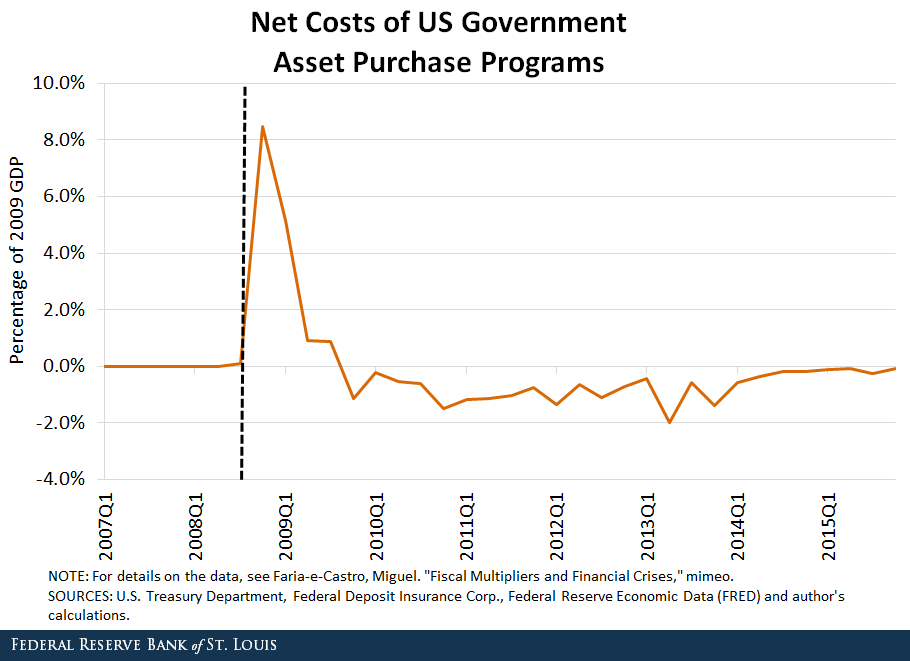
Fortunately, this scenario did not materialize: Most guarantees expired without being triggered, and most purchased assets were either sold or repaid. The figure below shows net costs of the asset purchases to the U.S. government.

They were positive when the government purchased assets and negative when these assets were repaid, sold or paid dividends/interest. These net costs were very large during the crisis, exceeding 8 percent of GDP by late 2008.
As the financial system weathered the worst part of the crisis and conditions improved, many of these assets were repurchased from the government, resulting in inflows to the Treasury. In fact, some TARP programs, such as the aforementioned CPP, resulted in a net profit for the government.
As this blog post argues, this “measure of success” should be taken with a grain of salt, as ex-post outcomes ignore the risks that the government took when deploying these programs and how costly they could have been to the taxpayer.
Notes and References
1 Implemented as part of the Emergency Economic Stabilization Act of 2008, enacted Oct. 3, 2008.
Citation
Miguel Faria-e-Castro, ldquoHow Risky Are Government Intervention Programs?,rdquo St. Louis Fed On the Economy, Aug. 7, 2018.
This blog offers commentary, analysis and data from our economists and experts. Views expressed are not necessarily those of the St. Louis Fed or Federal Reserve System.
Email Us
All other blog-related questions


