


Federal Income Taxes by Income Bracket
More than 60 percent of federal income tax returns come from people making less than $50,000 per year. Yet this group contributes about 7 percent of the individual income tax revenue collected. These are among the many details covered in a recent Economic Synopses essay examining federal tax collection facts.
Senior Economist Fernando Martin began by providing a snapshot of federal revenues collected for fiscal year 2016. The table below shows the breakdown.
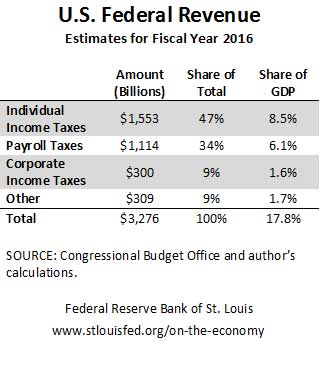
Individual Income Taxes
Martin focused the remainder of his essay inspecting individual income taxes in more detail, as they make up nearly half of federal revenue. The table below breaks these taxes down by adjusted gross income brackets and four categories. (Note that the data are for fiscal year 2014, the most recent year with data by income levels.)
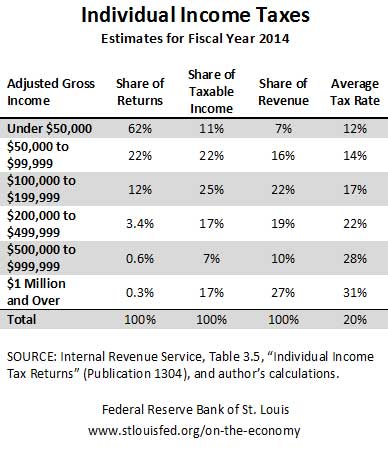
Martin commented on some of the differences between the lowest and highest income categories. He noted that tax rates increase up the income ladder due to the progressive nature of the U.S. income tax code.
For example, he noted that those earning less than $50,000 annually accounted for nearly two-thirds of all tax returns, but contributed only 7 percent of total revenue from individual income taxes. He wrote: “Around half of the filers in this group report zero taxable income; for those with taxable income, the average income tax rate is 12 percent.”
On the other end, filers making at least $1 million annually accounted for 0.3 percent of all returns, but contributed 27 percent of total revenue from individual income taxes. Martin noted: “Their average tax rate—31 percent—is almost triple that of filers in the lowest income bracket.”
He also noted that a group’s contribution to total revenue also depends on taxable income. For example, the group earning between $100,000 and $199,999 annually has an average tax rate of 17 percent but contribute 22 percent of revenue. This is the second-highest total amount by the groups examined, behind those earning at least $1 million.
Martin wrote: “The reason is that there are many more filers in the former group (12 percent versus 0.3 percent), who together generate about one-quarter of total taxable income (versus 17 percent for the highest earners).”
Implications of Tax Reform
Martin discussed how this breakdown by income can illustrate potential effects of tax reform. He gave an example of trying to close the deficit by raising the tax rates on the highest earners (those making $500,000 or more).
The deficit estimate for 2016 is $590 billion. The income tax revenue generated by the highest earners is roughly equal to the deficit, so their tax rate would have to double from around 30 percent to around 60 percent to generate enough revenue to cover the deficit.
Martin wrote: “A tax increase of this magnitude, however, might decrease the incentives for high-income earners to work as hard and encourage them to seek new ways to shield their income. Hence, in practice, the tax rate may need to be raised further and even then might not be enough to raise all the additional revenue.”
Additional Resources
- Economic Synopses: A Closer Look at Federal Income Taxes
- On the Economy: Why Doesn’t Capital Always Flow to High-Growth Areas?
- On the Economy: The Great Recession’s Effect on the Federal Budget
Citation
ldquoFederal Income Taxes by Income Bracket,rdquo St. Louis Fed On the Economy, Jan. 11, 2017.
This blog offers commentary, analysis and data from our economists and experts. Views expressed are not necessarily those of the St. Louis Fed or Federal Reserve System.
Email Us
All other blog-related questions