Recent Rise in Housing Costs Belies Long-Term Affordability
In recent months, average apartment rents and house prices have grown faster than incomes and inflation nationwide, skyrocketing to record highs in some metro areas.
However, this follows a longer period during which housing affordability across the U.S. generally increased; that is, housing costs increased more slowly than incomes.
The net result is that, on average for the nation as a whole and in many locations, both apartment rents and house prices are lower in 2016 relative to per capita incomes than they were 25 years ago. Thus, despite the recent rapid increases in rents and house prices in some high-profile areas, housing generally remains more affordable for the average family today than a quarter-century ago.
A look at housing affordability in recent years: 2011-2016
Average apartment rents in the U.S. increased by about 3.1 percent annually during the five-year period ending in the second quarter of 2016. Meanwhile, average U.S. house prices increased by 5.3 percent annually.1
Both of these rates of increase easily outpaced overall inflation of 1.3 percent during this period.2 In addition, they increased slightly faster than per capita personal income, which expanded at an annual average rate of 3 percent.3 Thus, housing costs have increased in real terms and faster than income growth, reducing average housing affordability.
However, over the long term, housing costs generally have increased more slowly than per capita incomes.
A look at housing affordability over time: 1991-2016
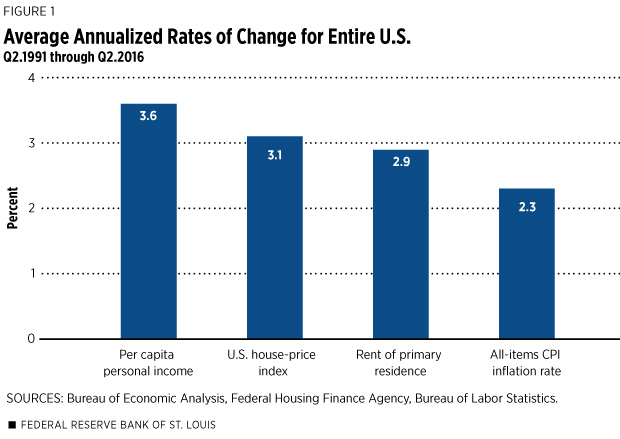
Figure 1 shows that over the past 25 years, apartment rents across the country increased at a rate just under 3 percent annually, with house prices rising an average 3.1 percent. While the all-items CPI inflation rate was 2.3 percent, per capita personal income grew at an annual rate of 3.6 percent, outpacing both housing costs and overall inflation.4 Despite house prices and rents rising faster than inflation, housing affordability has actually improved nationwide during the past quarter-century.
Regional differences in affordability
To be sure, rents and house prices have increased faster in some regions and metro areas than others in recent years. To illustrate differing regional trends in housing costs, incomes and inflation since 2011, Table 1 provides data for one major metropolitan area in each of the four U.S. census regions: Atlanta in the South, Chicago in the Midwest, Los Angeles in the West and New York in the Northeast.
Since 2011, increases in apartment rent and house prices exceeded local inflation rates in all four metro areas. Thus, housing has become more expensive in real terms.
However, only Atlanta and Los Angeles clearly showed a decline in housing affordability, since growth in both house prices and rent prices exceeded per capita income growth in those cities. In Chicago, house prices grew faster than incomes, but rents grew more slowly. In New York, both house and rent prices grew more slowly than incomes. Thus, while housing costs increased in real terms in all four cities during the last five years, trends in housing affordability were mixed.
Table 2 summarizes trends in housing costs, income and inflation for Atlanta, Chicago, Los Angeles and New York since 1991. First, note that apartment rents and house prices increased faster than the overall rate of inflation in every city. By these measures, housing has become more expensive in real terms.
Growth in per capita personal income is a benchmark for determining affordability and, since 1991, housing has become more affordable on this measure for the average person in all four major metro areas (or essentially has not changed in the case of Los Angeles house prices.) In cities with relatively fast growth in rent and house prices like Los Angeles and New York, per capita income growth has also been relatively strong. At the same time, incomes grew more slowly in cities like Atlanta and Chicago, but housing costs also grew more slowly. As the last two rows in Table 2 make clear, long-term housing affordability for the average family generally has improved in all four cities and for both rented and owned housing during the last quarter-century. Only Los Angeles owner-occupied housing represents a counter-example to this conclusion, albeit a small one.
Cycles versus trends in the long view of housing affordability
Both rents and house prices go through pronounced cycles that sometimes differ by region. While increases in rents and house prices nationwide and in major metro areas have reduced housing affordability in recent years, they do not reverse a longer-term trend toward greater average housing affordability. To be sure, some families and some regions face significant housing affordability challenges. But long-term data suggest that housing markets in most major cities remain reasonably effective in providing affordable rented and owned housing for the average family.

Endnotes
- Consumer Price Index, Bureau of Labor Statistics and Expanded-Data House-Price Index, Federal Housing Finance Agency; see www.bls.gov/news.release/cpi.toc.htm and www.fhfa.gov/DataTools/Downloads/Pages/House-Price-index-Datasets.aspx, respectively. Although “rent of primary residence” includes all types of housing units that are rented, I use the term apartments for convenience. All annualized rates of change are continuously compounded. [back to text]
- The average annualized rate of inflation excluding shelter costs was only 0.6 percent. [back to text]
- Personal Income and Outlays, Bureau of Economic Analysis. See http://www.bea.gov/newsreleases/national/pi/pinewsrelease.htm. [back to text]
- Excluding the cost of shelter, inflation averaged 2.1 percent. [back to text]
- Regional Consumer Price Index for All Urban Consumers, Bureau of Labor Statistics. The table shows average annual continuously compounded rates of change in the price index for the expenditure category “rent of primary residence.” Data are through the second quarter of 2016. See http://www.bls.gov/eag/eag.ga_atlanta_msa.htm and similar for other cities shown in the table. [back to text]
- Expanded-Data House-Price Index, Federal Housing Finance Agency. I estimate 2016 values by multiplying the annual average value for 2015 by the year-over-year percent change through the second quarter of 2016. See http://www.fhfa.gov/DataTools/Downloads/Pages/House-Price-index-Datasets.aspx. [back to text]
- Regional Economic Accounts, Bureau of Economic Analysis. See http://www.bea.gov/regional/. I estimated 2015 and 2016 values by splicing annual metropolitan-area data through 2014 to quarterly state-level data through the first quarter of 2016. For 2015, I applied the state-level four-quarter growth rate through the second quarter of 2015 to the metropolitan area. For 2016, I applied the four-quarter state-level growth rate through the first quarter of 2016 to the estimated 2015 value. [back to text]
- Regional Consumer Price Index for All Urban Consumers, Bureau of Labor Statistics. [back to text]
- I subtracted the continuously compounded five-year average annual all-items CPI inflation rate for each metro area from its five-year average annual change in per capita personal income. [back to text]
- For Atlanta before 1998, I used the CPI index for rent of primary residence in the South region for metropolitan areas with at least 1.5 million residents. [back to text]
- The calculation is 3.73 percent minus 3.68 percent, resulting in -0.05 percent; this rounds to -0.1 percent. [back to text]
This article originally appeared in our Housing Market Perspectives publication.
Citation
William R. Emmons, ldquoRecent Rise in Housing Costs Belies Long-Term Affordability,rdquo St. Louis Fed On the Economy, Sept. 1, 2016.
This blog offers commentary, analysis and data from our economists and experts. Views expressed are not necessarily those of the St. Louis Fed or Federal Reserve System.
Email Us
All other blog-related questions


