


Matching Jobs with the Right Skill Levels

One of the most trying quests in life is to find one’s self. There’s a great deal of insight into this difficulty in any John Hughes movie: The nerds wish they could be jocks, the deadheads secretly envy the preps, and the punks want to be anyone else.
This period of discovery isn’t limited to just adolescence, however. Many people spend their working careers trying to find jobs that match their personalities and skills. So who does the best job of making these matches: high-skill workers or low-skill workers?
Thinking casually, we could imagine stories to explain either direction:
- Highly skilled workers have spent years learning their craft and, in turn, learning about their own strengths and weaknesses.
- Workers with fewer job-relevant skills may find it easier to find jobs with low skill requirements.
The figure below shows the average level of mismatch at various skill levels.1
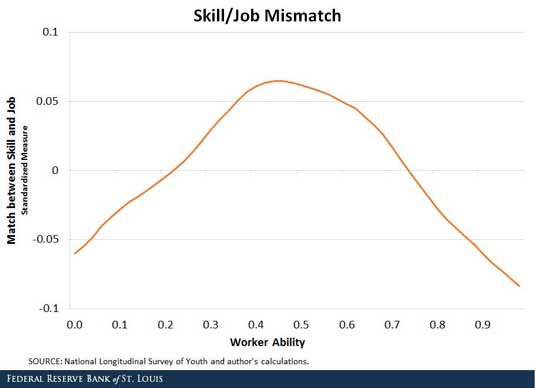
It turns out that the middle of the skill distribution is most mismatched by our measure. The measure reflects both the initial occupational choices and all of the switching that happens through the labor market. It says that a worker at the 20th percentile of the ability distribution has an average mismatch throughout his life near the overall mean.
However, there is relatively little variation: Finding the right job is a challenge at all levels. Mismatch varies by 10 percent of a standard deviation from the worst mismatched around the median to the best, at the lowest and highest part of the ability distribution. Depending on how you look at it, this is interesting because the peak mismatch is in the center of the skill distribution, or it’s interesting because differences in average mismatch are statistically but not particularly economically significant.
The measure reflects both the initial occupational choices and all of the switching that happens through the labor market. It says that a worker at the 20th percentile of the ability distribution has an average mismatch throughout his life near the overall mean, which may have occurred. The measure, while imperfect, is a bit more evidence in support of The Breakfast Club: “We're all pretty bizarre. Some of us are just better at hiding it, that's all.”
Notes and References
1 To construct the figure, we used the National Longitudinal Survey of Youth, which followed a young cohort from 1979 and through middle age. (This is the same data used in my working paper “Multidimensional Skill Mismatch,” co-written with Fatih Guvenen, Burhan Kuruscu and Satoshi Tanaka.) Each respondent took a battery of skills tests, from which we created an aggregated measure that’s used as the horizontal axis. We matched these test scores with the requirements of the workers’ occupations used the distance to compute the level of mismatch. We plotted that on the vertical axis after standardizing it to have zero mean and unit standard deviation. We standardized the measure, so the vertical axis shows fractions of a standard deviation.
Additional Resources
- On the Economy: Aging Populations May Mean Lower Economic Growth
- On the Economy: Labor Compensation and Productivity Gap Keeps Growing
- On the Economy: How Does Available Credit Affect Finding Jobs?
Citation
David G Wiczer, ldquoMatching Jobs with the Right Skill Levels,rdquo St. Louis Fed On the Economy, Sept. 22, 2016.
This blog offers commentary, analysis and data from our economists and experts. Views expressed are not necessarily those of the St. Louis Fed or Federal Reserve System.
Email Us
All other blog-related questions