Rising Education Costs Have Had Little Impact on Household Budgets
The average annual growth in the consumer price index has been fairly low (only 2.5 percent on average) and stable (with a standard deviation of 0.93 percent) during the past two decades. However, inflation rates across consumption goods and services show diverse patterns. The prices of consumption goods have dropped rapidly, while the prices of professional services, health care and education have risen dramatically.1 In particular, the rising cost of education has drawn considerable attention, though its impact on individual household budgets seems limited.
For comparison’s sake, the figure below plots the price indexes for consumption goods and educational services relative to the aggregate price index since 1990, illustrating how divergent the inflation rate has been between them. The price of educational services relative to the aggregate price level more than doubled in just over two decades. On the other hand, the relative price of consumption goods has declined by more than 30 percent over the same period.
The fast rise in the cost of education, especially skyrocketing college tuitions, has certainly attracted strong attention from the media. One of the main concerns is the heterogeneous impact this price increase has across the population, especially on the poor. The increasing relative price level could affect the poor more than the rich if the poor spend a larger share of their income on education.
To shed light on this concern, a good starting point is to look at the differences in spending shares of consumption baskets across income groups and how these shares vary over time. We used survey data from the Consumer Expenditure Survey (CE), which collects household level data on consumption expenditures as well as household incomes.
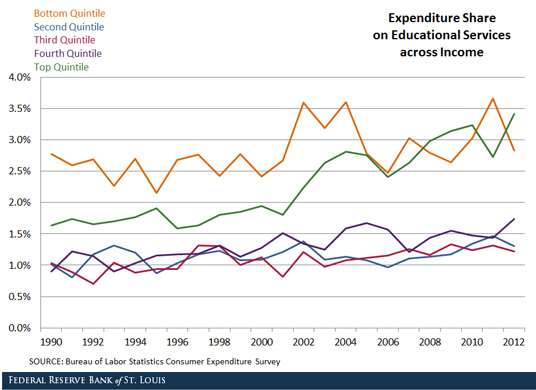
The figure below plots the average portion of income spent on educational services by income groups over time, calculated using CE data and dividing households into income quintiles.

A few results are worth highlighting.
Spending Shares
First, all income groups spent a relatively small share on education, ranging from less than 1 percent to a bit higher than 3.5 percent over the sample period. This relatively small share suggests a limited impact on household budgets, even though the relative price surged dramatically.
Variance in Shares
Second, the expenditure share was not monotonic across household incomes. The shares spent by households in the top and bottom quintiles were higher than shares of other quintiles, but only slightly. The poorest quintile spent the largest share of their income on education among all groups during recent years, while the top quintile spent the second-largest share. Hence, there is no obvious link between household incomes and the share of educational expenditures.2
Lack of Share Increases
Third, except for the top quintile, there is no clear trend on education spending over time. Even for that group, the share increase was quite insignificant, less than 2 percentage points in more than 20 years. The stability in education expenditure shares also indicates that all income groups were equally affected by the relative increase in the price of educational services.
Notes and References
1 Consumption goods here refer to commodities less food and energy.
2 Even if the share of expenditures on education remains roughly stable over time, the actual gap between the spending levels of the rich and poor could be rising because of an increase in income inequality over time.
Additional Resources
- On the Economy: Wealth Inequality May Be a Bigger Problem in the U.S. Than Income Inequality
- On the Economy: Student Debt in Low- and Moderate-Income Areas
- On the Economy: What’s Behind the Default Rate on Student Loans?
Citation
YiLi Chien, ldquoRising Education Costs Have Had Little Impact on Household Budgets,rdquo St. Louis Fed On the Economy, Nov. 10, 2014.
This blog offers commentary, analysis and data from our economists and experts. Views expressed are not necessarily those of the St. Louis Fed or Federal Reserve System.
Email Us
All other blog-related questions


