


Yielding Clues About Recessions: The Yield Curve as a Forecasting Tool
This past April, the U.S. economy marked its seventh straight year of expansion. Unemployment is now at its lowest level in nearly a quarter century, inflation is in check, and the stock market is booming. Do these cheery data suggest that the business cycle finally has been tamed, or is a recession lurking just around the corner? Increasingly, an old economic stool—the yield curve—is gaining prominence as a way to answer such questions.
Yields and Maturity
To understand why the yield curve is such an accurate forecaster of recessions, it is necessary to review a few interest rate fundamentals. The yield curve is a plot of the interest rate yields on debt instruments of different maturities, holding risk, liquidity and tax treatment constant. In the United States, the yield curve is typically drawn for Treasury securities. More often than not, the Treasury yield curve slopes upward, indicating that long-term Treasury securities offer higher yields than short-term ones.
What determines the slope of the yield curve? One explanation—the expectations theory—holds that expectations about future interest rates account for the relationship between yields and maturity, and, thus, the slope of the curve. This theory assumes that instruments of different maturities are equally attractive to investors, who care only about returns. Therefore, investors will buy and sell instruments of different maturities until long-term rates reflect an average of the short-term rates that are expected to prevail in the future.
As an example, suppose that a one-year bond pays 5 percent today, and a similar bond, bought one year from now, is expected to pay 7 percent.1 An investor with a two-year investment horizon has several options. He can purchase a one-year bond today and another one-year bond a year later, earning himself a 6 percent return—assuming that 7 percent is the interest rate on one-year bonds a year from now. Alternatively, the investor could purchase a two-year bond today and hold it to maturity. What annual yield must the two-year bond offer? It must, of course, yield at least 6 percent to prove as attractive as the first option. If it earned less, say 4 percent, investors would sell it, thereby driving the price down and the yield up until the yield equaled 6 percent—the return available by investing in two consecutive one-year bonds. Thus, a two-year bond paying 6 percent embodies market expectations that the interest rate on the one-year bond a year from now will be 7 percent.
Why is the slope of the yield curve generally positive? The expectations theory does not provide a satisfactory answer to this question because it maintains that long-term rates would consistently exceed short-term rates only if markets consistently expect rates to rise in the future. Such an expectation doesn't seem plausible, however. In fact, evidence indicates that investors expect rates to go up and down with equal probability.
Since the market expects future interest rates to be, on average, equal to current rates, which would not account for a generally upward-sloping yield curve, some modification of the expectations theory is needed. This modification takes the form of the preferred habitat theory. This theory maintains that the interest rate on a long-term bond will equal the average of the short-term interest rates expected to prevail over the life of the bond, plus a term premium. Investors demand such a premium because they are risk averse and dislike the potential for large capital losses on long-term debt. Large capital losses are possible because a given change in interest rates would provoke a bigger change in the price of long-term bonds than in the price of short-term ones. According to the preferred habitat theory: If the going rate on a one-year bond today is 10 percent; the rate expected to prevail on one-year bonds in one year is 14 percent; and the term premium required by investors to induce them to hold two-year bonds is 1 percent, then the going rate on two-year instruments today should be 13 percent.
How Does the Yield Curve Forecast Recessions?
Although the yield curve generally slopes upward, it occasionally "inverts." Since 1960, an inverted yield curve—one with higher short-term rates than long-term rates—has preceded all five recessions.
So how does an inverted yield curve signal a coming recession? Although term premiums do change over time, most of the day-to-day movement in the yield curve reflects changes in market expectations of future short-term interest rates. A steepening yield curve—that is, one with an increasing spread between long- and short-term rates—usually implies an expectation of higher short-term rates in the future. A flattening curve, on the other hand, implies an expectation of falling short-term rates.
Market expectations of future interest rates, in turn, reflect expectations of future real economic activity and monetary policy. During a recession, for example, short-term rates typically fall as the real demand for credit weakens and the Fed eases monetary policy. If investors anticipate a recession, they will expect short-term rates to tumble. This expectation can then translate into an inverted yield curve if the anticipated decline is both large and persistent enough to offset the term premium.
Federal Reserve Bank of New York economists Arturo Estrella and Frederic Mishkin recently compared the record of the Treasury yield curve as a recession predictor with the records of other widely used indicators of future economic activity. (See Chart 1.) They found that the spread between long- and short-term interest rates—a measure of the yield curve's slope—out performed many highly regarded forecasting measures, including the Commerce Department's index of leading economic indicators and the stock market.
The Probability of a Recession Based on the Interest Rate Spread Between the 10-Year Treasury Note and the Three-Month Treasury Bill
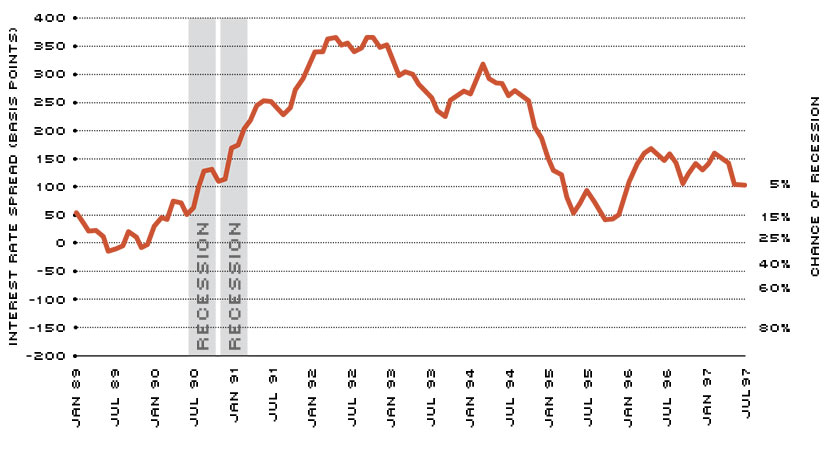
SOURCE: Estrella and Mishkin (1996)
Note: According to Estrella and Mishkin, the smaller the interest rate spread between long- and short-term interest rates, the greater the probability of a recession four quarters ahead. For example, before the 1990-91 recession, the yield curve inverted, and the interest rate spread dipped to –15 basis points—implying a recession probability of about 30 percent. Currently, the spread is roughly 100 basis points, implying a recession probability of less than 10 percent.
Specifically, Estrella and Mishkin estimated recession probabilities based on the interest rate spread between the 10-year Treasury note and the three-month Treasury bill. They found that a spread greater than 1.2 percentage points translates into a recession probability of less than 5 percent. As the spread narrows, however, the recession probability increases—reaching roughly 25 percent when the two interest rates become equal. Once the yield curve inverts and the spread falls to a negative 0.8 percentage points, the probability of recession jumps to 50 percent. With a negative 2.4 percentage point spread, the likelihood of a recession rises to 90 percent. In sum, the probability of recession rises moderately as the yield curve flattens and increases dramatically as it inverts.2
To see the relationship between the yield curve and recessions more clearly, consider the behavior of the yield curve spread over the past 15 years. In the first quarter of 1981, the spread averaged –2.18 percentage points, translating into an 86.5 percent probability of a recession four quarters ahead, according to Estrella and Mishkin's calculations. Indeed, by early 1982, the economy was in the midst of a severe recession that would last 16 months and feature unemployment rates above 10 percent.
Over the next 92 months, the U.S. economy experienced its longest peace time expansion ever, with the spread remaining consistently above 1 percentage point for an average of 1.87 percentage points. In the summer of 1989, however, the spread briefly became negative—foreshadowing the mild recession that began in July 1990 and lasted only eight months. After the recession, the yield curve assumed its typical shape, with the spread remaining above 2 percentage points between March 1991 and December 1994—signaling a remote likelihood of another downturn. Moving into 1995, the yield curve began flattening, and by November of that year, the spread was only 0.41 percentage points. Still, such a yield curve spread foretold only a 15 percent chance of recession four quarters ahead. And, true to prediction, no recession occurred in late 1996 or early 1997.
Is a Recession on the Way?
The slope of the current yield curve suggests that a recession is not likely in the next four quarters. Since November 1995, the interest rate spread between the 10-year Treasury note and the three-month Treasury bill has widened, topping 1 percentage point in March 1996 and remaining above that mark during the past year. According to Estrella and Mishkin, a yield curve with such a slope signifies a recession probability of less than 10 percent. Although the yield curve cannot guarantee good times in the coming year, the track record indicates that no tool offers better clues about the likelihood of coming economic troubles.
Endnotes
- Technically, Treasury securities with original maturities of one to 10 years are called "notes," while Treasury securities with maturities of more than 10 years are called "bonds." [back to text]
- Estrella and Mishkin's work has been criticized as statistically simplistic. With more sophisticated techniques, however, Dueker (1997) confirms that the yield curve outperforms other commonly used tools for forecasting recessions over the 1959-95 sample period. [back to text]
References
Dueker, Michael J. "Strengthening the Case for the Yield Curve as a Predictor of U.S. Recessions," Review, Federal Reserve Bank of St. Louis (March/April 1997), pp. 41-51.
Estrella, Arturo and Frederick S. Mishkin. "The Yield Curve as a Predictor of U.S. Recessions," Current Issues in Economics and Finance, Federal Reserve Bank of New York (June 1996).
Haubrich, Joseph G., and Ann M. Dombrosky. "Predicting Real Growth Using the Yield Curve," Economic Review, Federal Reserve Bank of Cleveland (First Quarter 1996), pp. 26-35.
Mishkin, Frederic S. The Economics of Money, Banking, and Financial Markets, 4th edition (New York: HarperCollins, 1995), pp. 157-67.
Views expressed in Regional Economist are not necessarily those of the St. Louis Fed or Federal Reserve System.
For the latest insights from our economists and other St. Louis Fed experts, visit On the Economy and subscribe.
Email Us