Federal Reserve Bank of St. Louis. "Auto Debt Expansion Continues to Slow While Subprime Delinquencies Rise, Vol. 1, Issue 4, Covering 2016:Q4," Quarterly Debt Monitor : Trends in Consumer Debt in St. Louis, Little Rock, Louisville, Memphis - and Beyond (2016:Q4). https://fraser.stlouisfed.org/title/6285/item/603192, accessed on May 22, 2025.

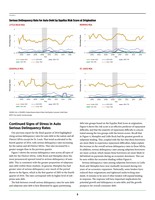
Title: Auto Debt Expansion Continues to Slow While Subprime Delinquencies Rise, Vol. 1, Issue 4, Covering 2016:Q4

Author: Ricketts, Lowell R.
Date: 2016:Q4
PREVIOUS / NEXT
Page 1
image-container-0 VO L . 1 , I SS U E 4 , COV E R I N G 2 01 6 : Q 4 D e b t Auto Debt Expansion Continues to Slow While Subprime Delinquencies Rise By Lowell R. Ricketts W hile real per capita consumer debt growth rose across the country in the fourth quar- ter of 2016, it declined or remained unchanged in most of the largest metropolitan statistical areas (MSAs) in the Eighth Federal Reserve District. 1 Declines in mortgage debt continued to temper overall debt growth. Lending in both the auto and student debt sectors rose, but was uniformly lower on a year-over-year basis when compared with our previous report for the nation and for the District MSAs of Little Rock, Ark., Louisville, Ky., Memphis, Tenn., and St. Louis. 2 Over the past few years, strong lending of auto and student debt has buoyed total debt, accounting for the majority of credit expansion. This report offers a closer look at auto lending, including the factors that contributed to the expansion in this sector. This report uses the latest release of the Federal Reserve Bank of New York and Equifax Consum- er Credit Panel with data as of the fourth quarter of 2016. The figures in this report help to provide a focused narrative of the latest developments in consumer debt across the District and nation. For a more extensive collection of figures updated each quarter, see the QDM appendix. 3 Latest Developments in Consumer Debt 1. In the fourth quarter of 2016, real per capita mortgage debt declined across the United States and the four District MSAs. The steep- est declines were in Louisville and Memphis, where per capita mortgage debt declined by 3.5 percent and 4.3 percent, respectively. 2. The serious delinquency rate for mortgage Changes in Per Capita Debt Levels and Serious Delinquency Rates Year-over-Year Percent Change from 2015:Q4 to 2016:Q4 2016:Q4 United States St. Louis MSA Total 0.4 0 1.5 –1.5 –0.8 Mortgage –0.9 –1.8 –0.5 –3.5 –4.3 HELOC –5 –6.7 –11.5 –2.8 –6.8 Auto 5.1 4.2 4 5.4 5.5 Credit Card 2.9 1.4 3.8 0.9 3.4 Student 5.3 5.6 6.7 4.8 6.6 Mortgage –0.5 –0.2 –0.6 –0.1 –0.7 HELOC 0.1 –0.2 0.1 0.1 0.2 Auto 0.4 0.1 0.6 0.5 1.2 Credit Card –0.2 –0.1 0 –0.4 –0.1 Student –0.2 0.4 0.1 0.1 –0.1 Little Rock MSA % Change in Per Capita Consumer Debt Change in Serious Delinquency Rate SOURCE: Federal Reserve Bank of New York/Equifax Consumer Credit panel. Louisville MSA Memphis MSA NOTES: Serious delinquency rates are the shares of outstanding debt that is over 90 days past due. Changes to those rates are given as the differences in percentage points. Figures are rounded. debt fell both nationally and across the District MSAs, with the MSAs reaching their lowest levels since before the Great Recession. Mean- while, although the national rate has fallen, it still remains above its pre-recession low. 3. Per capita HELOC, or home equity line of credit, debt declined across the nation and all of the District MSAs. HELOC debt, an impor- tant source of consumer debt growth prior to the recession, continues to show a pattern of consistent deleveraging. 4
image-container-1 2 2 4. Growth in per capita student debt slowed for the nation and all District MSAs. The average growth rate across the four MSAs fell to 5.9 percent in the fourth quarter, down from 7.2 percent in the third quarter. 5. Per capita credit card debt continued to grow for the nation as well as for all District MSAs. At the same time, rates of serious delinquency fell or remained unchanged. Credit card debt remains well below pre-recession levels and rates of serious delinquency. 6. For the third quarter in a row, growth in per capita auto debt slowed across the District MSAs. While auto debt remains a significant contributor to overall growth, the robust growth observed over the past few years continues to abate. With the exception of Louisville, the slowdown has been more pro- nounced across the District MSAs than the nation. 7. Repayment difficulty among auto loan borrowers continued to worsen and at a faster pace since our previous report. Seri- ous delinquency rates in Louisville and Little Rock were 3.4 and 4.3 percent, respectively. Those rates match or exceed the previous peak seen after the recession. 8. Subprime auto debt comprised 38 percent of outstanding auto debt in Memphis and 28 percent in Little Rock during the fourth quarter of 2016. Subprime debt has been growing fastest in both MSAs and exceeds the amount of prime debt in those markets. 5 9. Serious auto delinquency rates were higher and increasing faster for subprime borrowers in all four MSAs. Given the growing share of subprime debt within these MSAs, this may contribute to further increases in overall serious delinquency rates. Much of this lending was originated by auto financing companies rather than banks or credit unions. Waning Momentum for Consumer Debt Almost all consumer debt growth continues to be driven by strong growth in a few categories of debt. Without the contribu- tions of new student and auto debt over the past few years, the deleveraging seen after the Great Recession would likely have continued. Since mortgage debt comprises a majority share of consumer debt, changes within this category have a consider- able impact on total debt. Figure 1 shows the growth of various types of debt as a contribution to the change in total per capita debt. 6 This figure provides a clear picture of the drivers of overall growth. Continued deleveraging of mortgage debt continues to curb overall growth. 7 Deleveraging has been particularly strong in both Louisville and Memphis. In Memphis, despite the strongest growth in student and auto debt among the District MSAs, total debt has fallen because of the sizeable reduction in mortgage debt. Very low serious delinquency rates for mortgage debt suggest that defaults are less of a contributing factor to these reductions. Percent F E D E R A L R E S E RV E B A N K O F ST. LO U I S 1 0 –1 –2 SOURCE: Federal Reserve Bank of NY/Equifax Consumer Credit Panel. United States St. Louis MSA Louisville MSA Memphis MSA Little Rock MSA Debt Type Total Mortgage Auto HELOC Credit Card Student Other Contribution to Percent Change in Total Per Capita Debt 0.4 1.5 −1.5 −0.8 0 −0.6 −0.3 −2.3 −2.6 −1.2 0.4 0.5 0.4 0.6 0.4 −0.2 −0.2 −0.1 −0.2 −0.2 0.2 0.2 0.1 0.2 0.1 0.5 1 0.6 1 0.7 0.1 0.2 −0.1 0.1 0.2 Year-over-Year Change from 2015:Q4 to 2016:Q4 Contribution to Percent Change in Total Per Capita Debt FIGURE 1 SOURCE: Federal Reserve Bank of New York/Equifax Consumer Credit panel. NOTES: Growth in each type of debt is relative to total debt. All data labels have been rounded. F E D E RA L R E S E RV E B A N K O F ST. LO U I S 120 110 100 90 2005 2010 2015 2016:Q4 SOURCE: Federal Reserve Bank of NY/Equifax Consumer Credit Panel. NOTES: “Real” data are inflation-adjusted. The gray bar indicates recession. Memphis MSA Little Rock MSA United States St. Louis MSA Louisville MSA Year Index, 2003:Q1=100 Total Real Per Capita Auto Debt Total Real Per Capita Auto Debt FIGURE 2 SOURCE: Federal Reserve Bank of New York/Equifax Consumer Credit Panel. NOTES: “Real” data are inflation-adjusted. The gray bar indicates recession. F E D E RA L R E S E RV E B A N K O F ST. LO U I S 400 300 200 100 0 2002 2004 2006 2008 2010 2012 2016 2014 SOURCE: Federal Reserve Bank of New York/Equifax Consumer Credit Panel. NOTES: For inflation adjustment, 2009 dollars are used, in line with the Bureau of Economic Analysis’ personal consumption expenditures chain-type price index. Equifax developed the score to measure lending risk. Typically, credit scores below 620 are considered subprime. A score below 500 would qualify as deep subprime. These lower scores indicate that the borrower is more likely to have problems repaying the loan. 720-759 620-659 Under 620 Over 760 660-719 Billions 2009 $ U.S. Outstanding Auto Balances by Equifax Risk Score at Origination Year U.S. Outstanding Auto Balances by Equifax Risk Score at Origination FIGURE 3 SOURCE: Federal Reserve Bank of New York/Equifax Consumer Credit Panel. NOTES: For inflation adjustment, 2009 dollars are used, in line with the Bureau of Economic Analysis’ personal consumption expenditures chain-type price index. Equifax developed the score to measure lending risk. Typically, credit scores below 620 are considered subprime. A score below 500 would qualify as deep subprime. These lower scores indicate that the borrower is more likely to have problems repaying the loan.
image-container-2
image-container-3
image-container-4
image-container-5
image-container-6
image-container-7
image-container-8
image-container-9
image-container-10
image-container-11
image-container-12
image-container-13
image-container-14
image-container-15
image-container-16
image-container-17
image-container-18
image-container-19
image-container-20
image-container-21
image-container-22
image-container-23
image-container-24
image-container-25
image-container-26
About
Collections within FRASER contain historical language, content, and descriptions that reflect the time period within which they were created and the views of their creators. Certain collections contain objectionable content—for example, discriminatory or biased language used to refer to racial, ethnic, and cultural groups.